Maps
Palma provides a geographic information system (GIS) in order to be able to analyze in a simple way the spatial data that oasi makes available.
To access this tool click on the icon in the side menu.
This tool isn’t meant to replace more advanced programs such as QGIS or ArcGIS, which are still needed for advanced functions, but aims to provide a simple system for visual analysis of the various layers available.
Navigation and orientation
The map tool provides all the basic functionality one would expect to have in a GIS program.
Panning
To move the map hold down the left mouse button and drag the cursor in the desired direction.
Change scale and reset

Fig. 74 Zoom buttons
To change scale just click on the and e buttons to respectively increase and decrease the scale. Click button for return to the starting situation.
Zooming in to a specific area
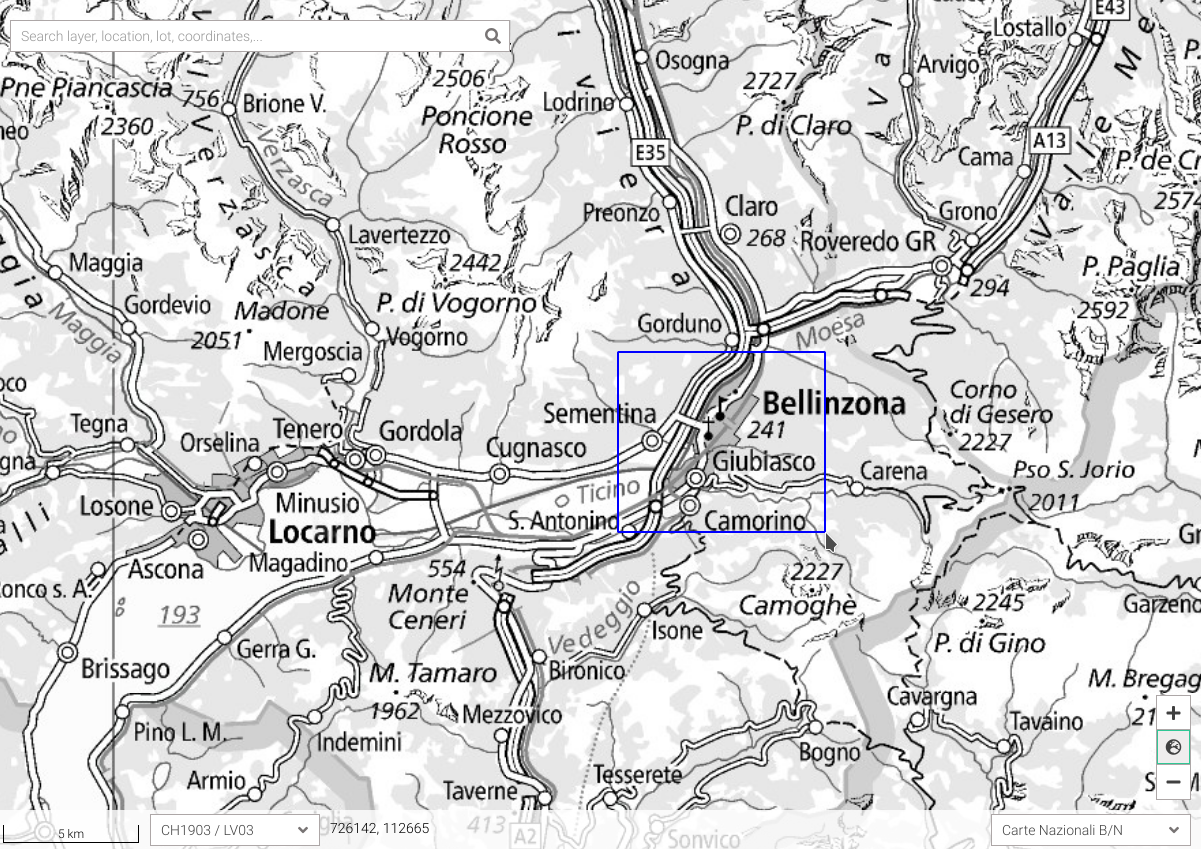
Fig. 75 Zoom box
To zoom in on a specific area (zoom box) simultaneously hold down the shift key + and drag the cursor until the desired rectangular area is obtained. When the mouse button is released, the zoom is performed.
Display coordinates and scale

Fig. 76 Coordinate and scale indication
By moving the cursor on the map, the coordinates corresponding to its position are displayed in the lower bar of the screen (Fig. 76).
Tip
To get more information about a given point on the map, use the contextual menu.
Change coordinate system
By clicking on the drop-down menu located to the left of the coordinates (Fig. 76) it’s possible to change the reference system. In this bar there is also (all to the left) the scale representing a given length on the map what distance it actually corresponds to.
Change the background map
On the right in the lower bar (Fig. 76) it’s possible, using the drop-down menu, to choose from some background maps.
Tip
For change the transparency of the background map hold down the shift key and scrolling with the mouse .
Selection and display of data
Selection of a geocatalog
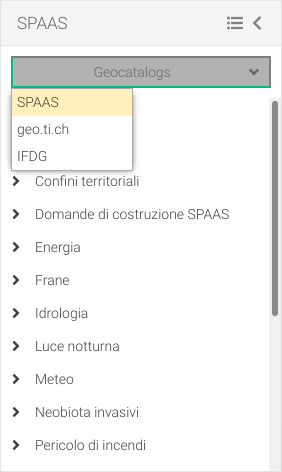
Fig. 77 Geocatalog list
To select a geocatalog, click on the drop-down menu and choose one of the possible options. Once the desired geocatalog has been selected, its layers will be displayed immediately below.
Tip
Holding the mouse over the title for a few moments will display the geocatalog description.
Selection of the layers
There are several ways to select a layer and it can be done using:
the tree list of geocatalog layers (Fig. 78),
the search field,
the table layers list of geocatalog,
the import tools.
Once a layer is selected it will be shown in the Selection box.
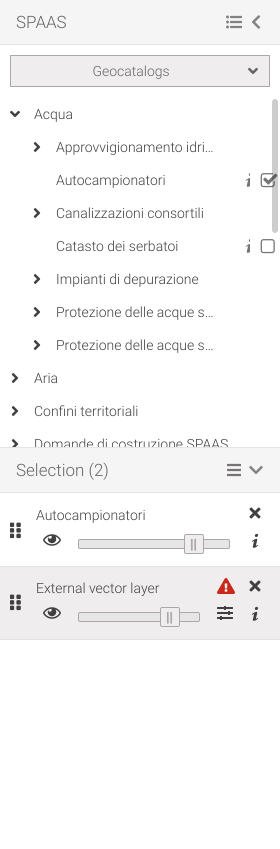
Fig. 78 Layers selection
By Clicking on the button will give access to the list of layers in a geocatalog in tabular form (Fig. 79). In this screen it’s possible to filter the layers using the Filter by title or description filter. Selecting one or more layers will activate the Add to map button that allows to add them to the Selection box. It’s also possible copy selected lines by pressing the Ctrl + C keys.
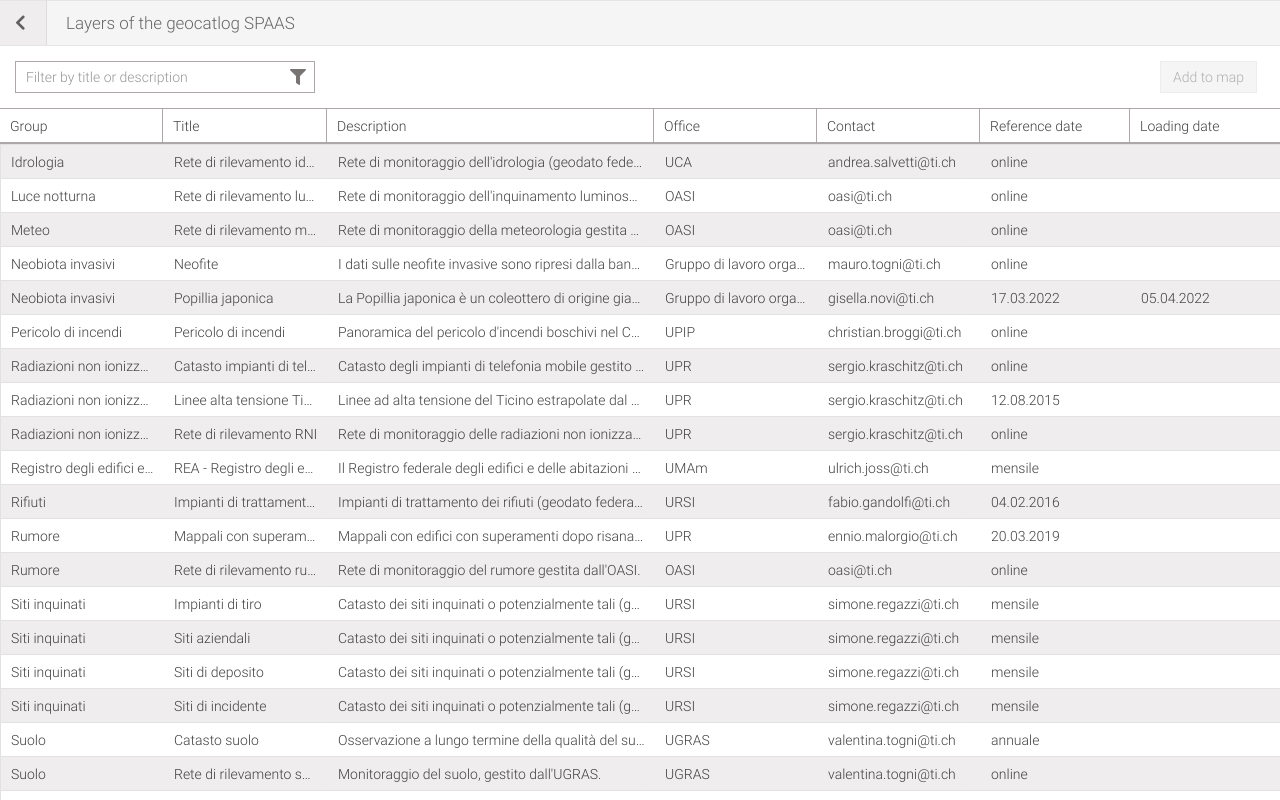
Fig. 79 Layers list present in a geocatalogue
Tip
In the layer list, selected rows can be copied.
Selected layers management
There are several ways to manage the selected layers.
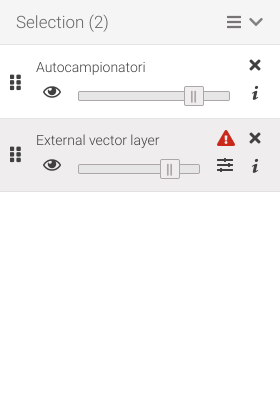
Fig. 80 Management of selected layers
Layers can be rearranged by drag and drop. By holding down the left mouse button on the icon , of a layer while dragging it, there is the possibility to change the order of the list. This allows to have one layer in the foreground rather than another.
With the button it’s possible to enable and disable the visibility of layer temporally.
Click the button to remove the layer from the list of selected ones.
To change the transparency of a layer just move the slider bar , by default the value is set to have a transparency of 80%.
The current layers selection can be saved in the Custom maps widget by clicking on the button , located to the right in the title, and then on the menu option (Fig. 81). This will open a window where it will be mandatory to enter a name, as desired, describing the layer group.

Fig. 81 Other actions on the map selection
In addition to the option, the names, if any, of all Custom maps previously saved in the dashboard will be listed. Clicking on the name of a custom map will load it immediately, deleting the current selection.
For imported (or external) vector-type layers there is also the possibility to change the style by clicking on the button . Doing so will open a window (Fig. 82) where it’s possible choose to change the stroke, fill and symbol style (only if the layer has points as geometry).

Fig. 82 Vector layer style option
It’s possible to have more information on the layer (Fig. 83) by clicking the button , for example to display the legend.
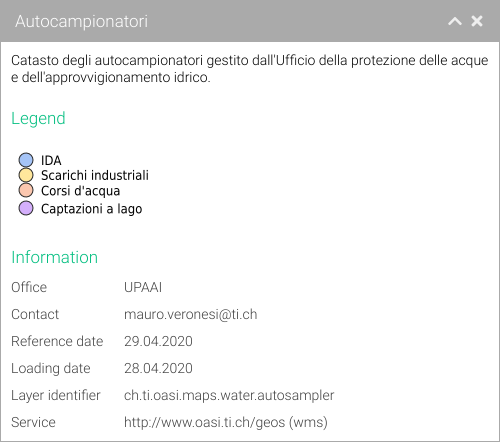
Fig. 83 Layer information
Search

Fig. 84 Search field
The search field (Fig. 84), located at the top left of the map, allows searches using keywords (e.g. ‘air’, ‘bellinzona’,…) within the available spatial data. The results are presented in three groups:
Layers (Fig. 85): layers list present in the oasi system,
Location (Fig. 86): locations list in Switzerland,
Lots (Fig. 87): lots list in Ticino.
By clicking on a result it will be displayed on the map.
The search returns a maximum of 10 results per group.
It’s possible enter the coordinates of a place in the search field to center the map on the selected point. These coordinates can be entered in:
CH1903+ / LV95: 2720000, 1127000 • 2720000/1127000 • 2720000 1127000
CH1903 / LV03: 720000, 127000 • 720000/127000 • 720000 127000
WGS84: 46.28376, 8.99570 • 46.28376/8.99570 • 46.28376 8.99570
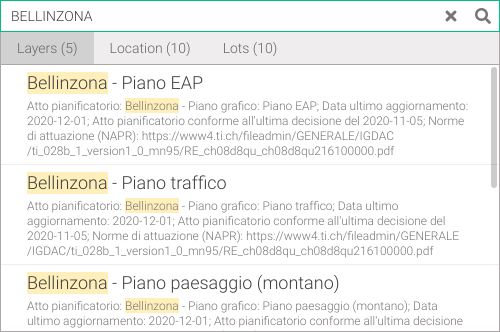
Fig. 85 Search results: layers |
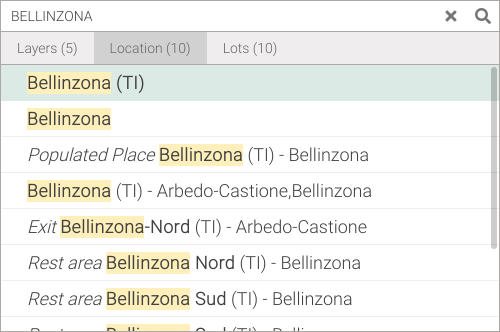
Fig. 86 Search results: locations |
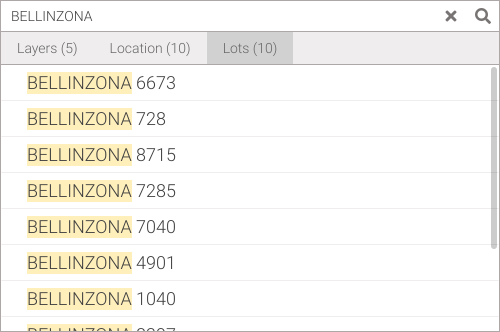
Fig. 87 Search results: lots
Information about an object on map
It’s possible to query the objects (points, lines, polygons and rasters) displayed on the map by clicking on them to obtain existing information in a window (Fig. 88).
If more than one layer is active or two objects of the same level are adjacent, information can be received with a single click which can be viewed individually by clicking on the « Previous and Next » buttons.
The object of interest will be highlighted on the map in orange color if its geometry (Fig. 88, Fig. 89, Fig. 89) or bounding box is available (Fig. 91). It could happen, especially on raster maps, that the bounding box consists only of the center of the object, therefore the selection will be displayed as if it were a point (Fig. 92). In the absence of geometry, the point clicked on the map will be highlighted, which will not be linked directly to the object and which therefore may not be representative if you change the zoom.
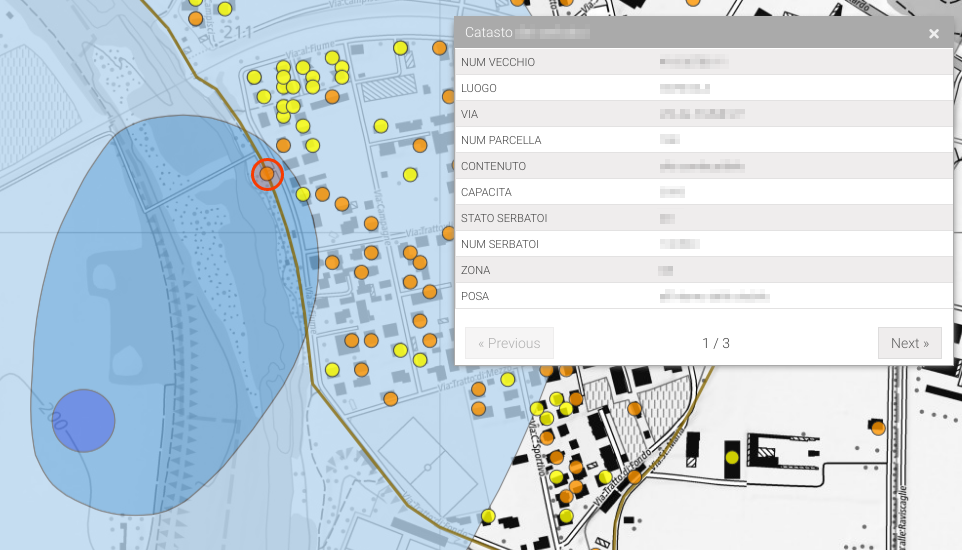
Fig. 88 Selected object with line geometry
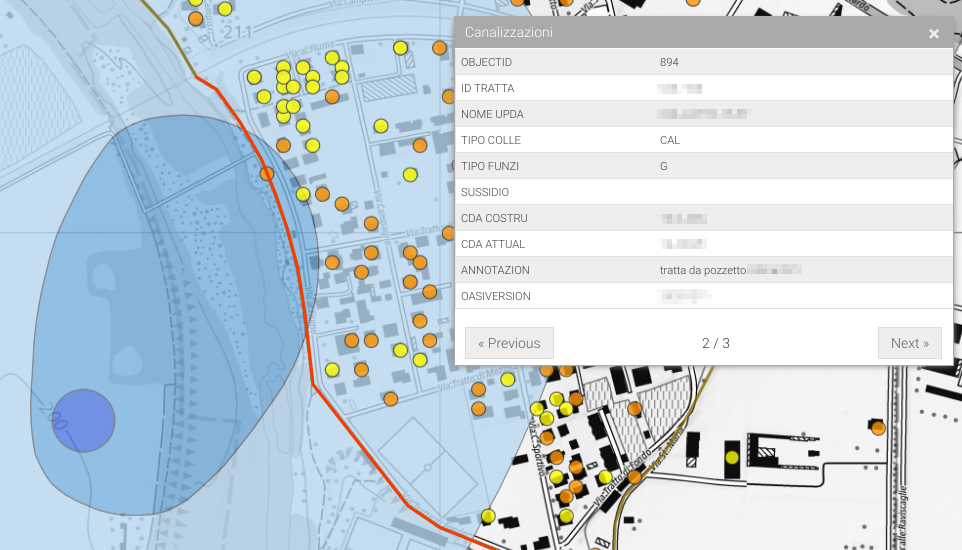
Fig. 89 Selected object with line geometry
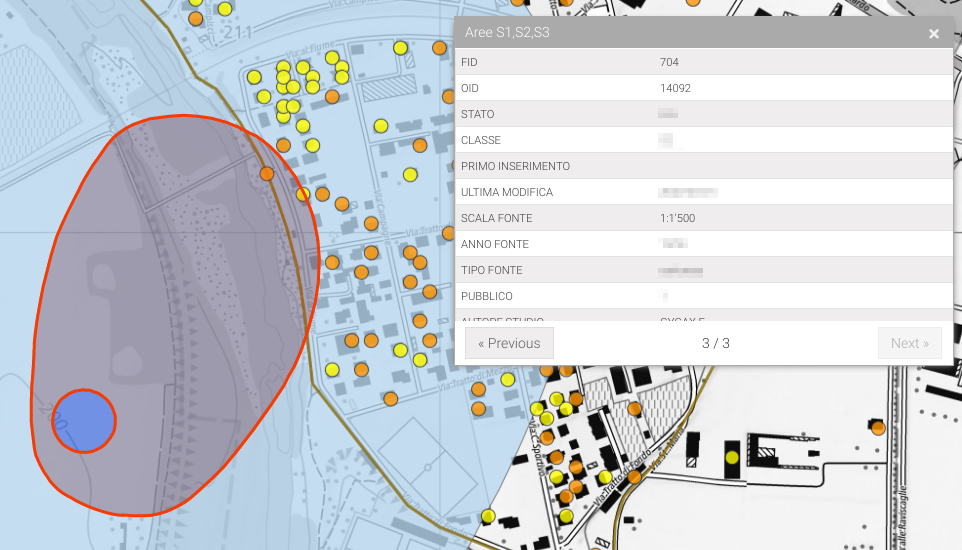
Fig. 90 Selected object with point or polygon geometry
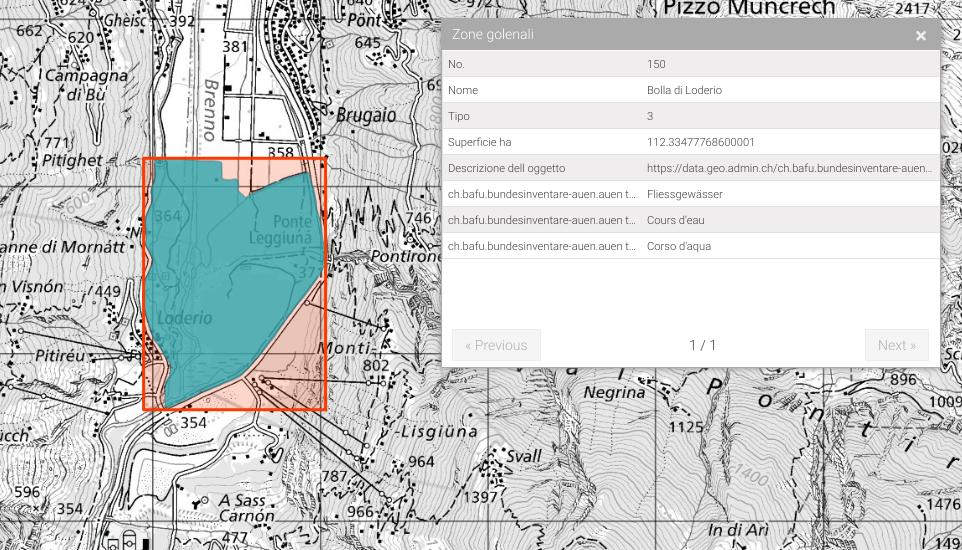
Fig. 91 Selected object with bounding box of geometry
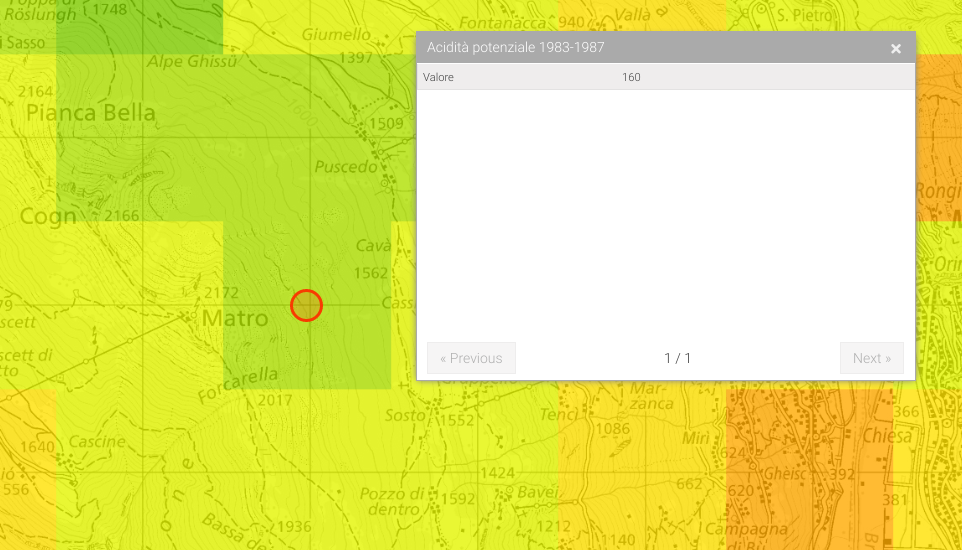
Fig. 92 Selected object with raster geometry
Context menu
The contextual menu (Fig. 93) can be accessed by clicking with the right mouse button anywhere on the map. This menu offers the following options:
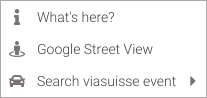
Fig. 93 Contextual menu of the map
What’s here? (Point information)
With this option it’s possible to display additional information about the location (e.g. address).
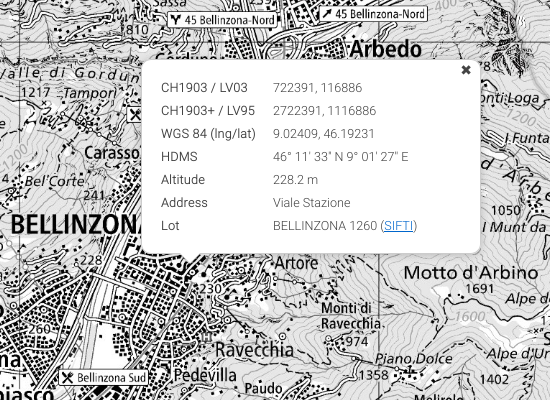
Fig. 94 ‘What’s here?’ option
Google street view
The Google street view option provides interactive panoramas , if any, along streets at the clicked point.
Note
You will be redirected to the official Google Maps site.
Warning
Not all streets are present and if you come across these points a black screen will appear. In the mini-map, at the bottom left, it’s possible to see the closest street that has this view.
Search a viasuisse event
With this option it’s possible to search for a Viasuisse event. By selecting it, a sub-menu will appear where it’s possible to insert filters. By entering a Date range and a Radius (km) within which to search, it’s possible to search if an event exists. It’s also possible to filter for a given Street by choosing from the drop-down menu. If there is at least one event, this will be displayed on the map with a line (Fig. 96) and by clicking on it some further information can be obtained (e.g. description of the event).
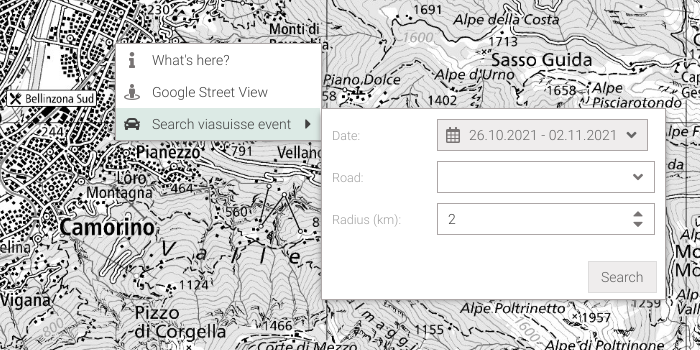
Fig. 95 Search viasuisse event
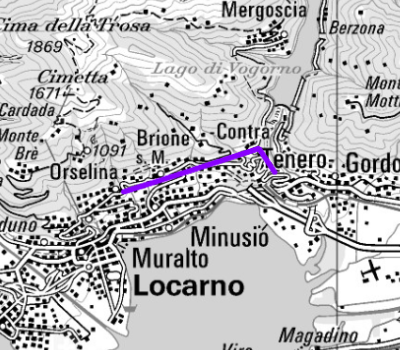
Fig. 96 Viasuisse event displayed
Tools
The Palma Maps system provides various tools that can be useful to the user for the purpose of an analysis.
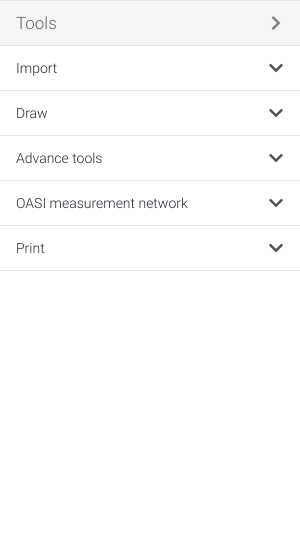
Fig. 97 Map tools
To access the tools list, click on the right sidebar Tools of the map.
Import
Three types of layers can be imported, via WMS, KML or Shapefile services.
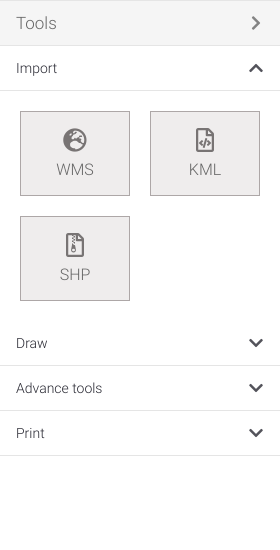
Fig. 98 Import tools
WMS import
A WMS layer can be imported by clicking on the right sidebar Tools ➔ Import and finally on the WMS button (Fig. 98). This will open a window (Fig. 99) where from the drop-down menu can be chosen a pre-set WMS services. It is also possible to enter an address of a WMS service that is not in the list, but as a prerequisite it must have CH1903/LV03 (EPGS:21781) as its reference system otherwise an error message will be showed.
Once the address is chosen clicking the Connect button will load the layers present in the WMS service in the box on the left (Fig. 100). To display one or more layers on the map simply click the check box. Selecting a layer in the box on the right will display its description, if available.
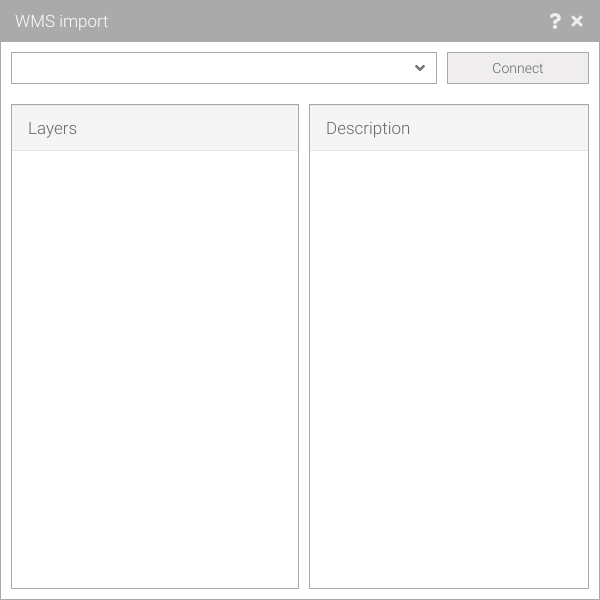
Fig. 99 Import WMS window |
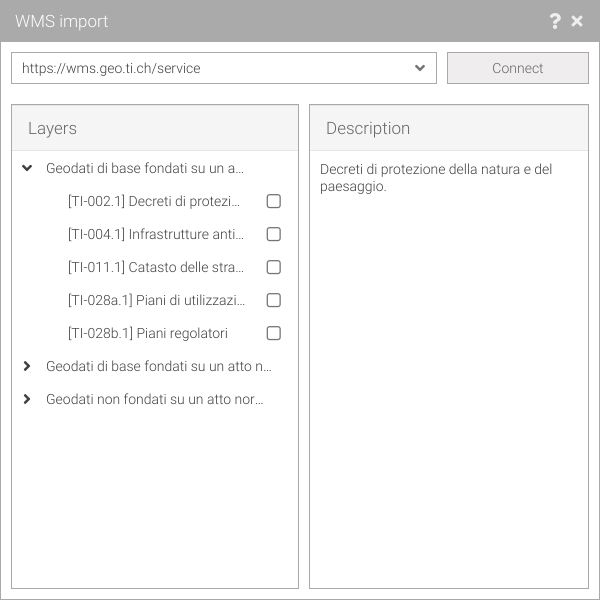
Fig. 100 Import window with WMS loaded |
Warning
Only WMS services that support the standards of the WMS OGC Standard can be displayed.
KML import
It’s possible to display KML documents by clicking on the right sidebar Tools ➔ Import and finally on the KML button (Fig. 98). A window will be open (Fig. 101) where there is the possibility to load the .kml (or .:file:kmz) file by clicking on the Browse button and finally on Load.

Fig. 101 KML import window
Warning
Only KML files without errors that comply with the OGC KML standards can be rendered.
Warning
Even if it’s a vector layer it’s not possible to change the style since this type of document allows to have the styles encoded in the file.
Shapefile import
It’s possible to display Shapefile documents by clicking on the right sidebar Tools ➔ Import and finally on the SHP button (Fig. 98). A window will be open (Fig. 102) where there is the possibility to load the .zip - containing all the .shp, .dbf and .shx files that make up a Shapefile - by clicking on the Browse button and finally on Load.

Fig. 102 Shapefile import window
Draw and measure
One has the ability to draw symbols, lines/polygons, circles and text on the map. It’s also possile to make measurements and export the drawing layer in KML format.
When one of these object is added on the map, a Drawing layer will be created among the selected layers list and can be managed like any other layer.
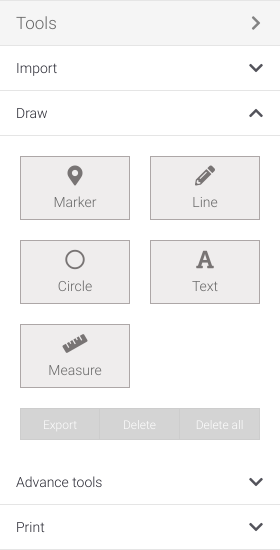
Fig. 103 Draw and measure tool
Warning
Layers added with this tool are marked with the symbol and cannot be shared but can be printed.
Add a marker
To add and a marker click on the right sidebar Tools ➔ Draw and select Marker. Click with the left mouse button on the desired location to add the symbol.
By selecting a marker - this will be marked with a white dot in the center - there is the possibility to modify it using the Color, Icon and Size drop-down menus that will appear below the drawing buttons.
It’s possible to move the marker by holding down the left mouse button on it and dragging it to the desired point, this will be positioned when the button is released.
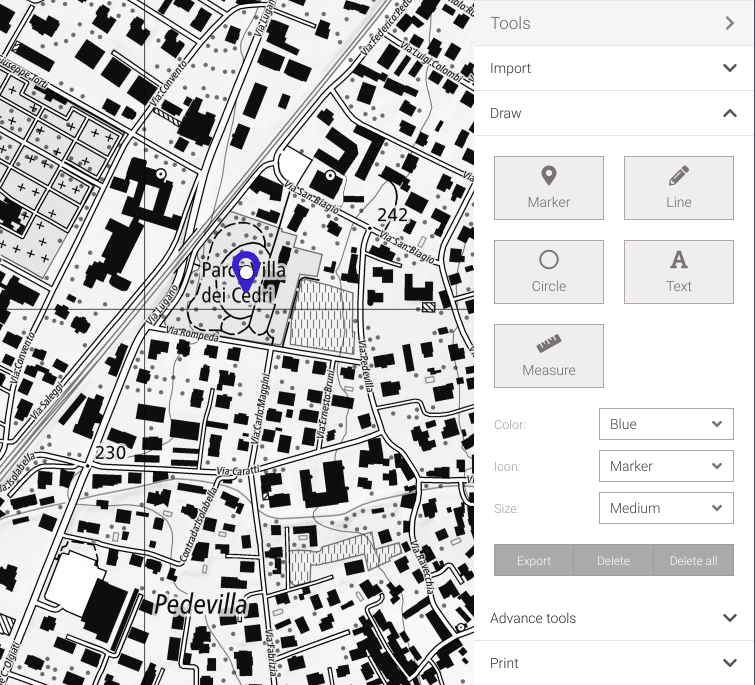
Fig. 104 Draw marker
Tip
Multiple objects can be selected for editing by clicking on them and holding down the Shift key at the same time.
Add a path / polygon
To add a path or polygon click on the right sidebar Tools ➔ Draw and select Line. Click with the left mouse button to start the path, continue clicking to add segments and double-click to end the path. If you finish the path at the starting point it will create a polygon. While creating the path you can use the Delete key on the keyboard to delete the last point.
By selecting a path or polygon - this will be marked with white dot for each vertex and on the start and end points - there is the possibility to modify it using the Color or Width (for the line width) drop-down menu that will appear below the drawing buttons. Positioning over the path, if selected, a blue dot will appear following the movement of the mouse and by clicking on it you can add a new vertex. All vertices can be moved by holding down the left mouse button and dragging the cursor in the desired direction. To remove a vertex, click on it with the left mouse button while holding down the Alt key on the keyboard.
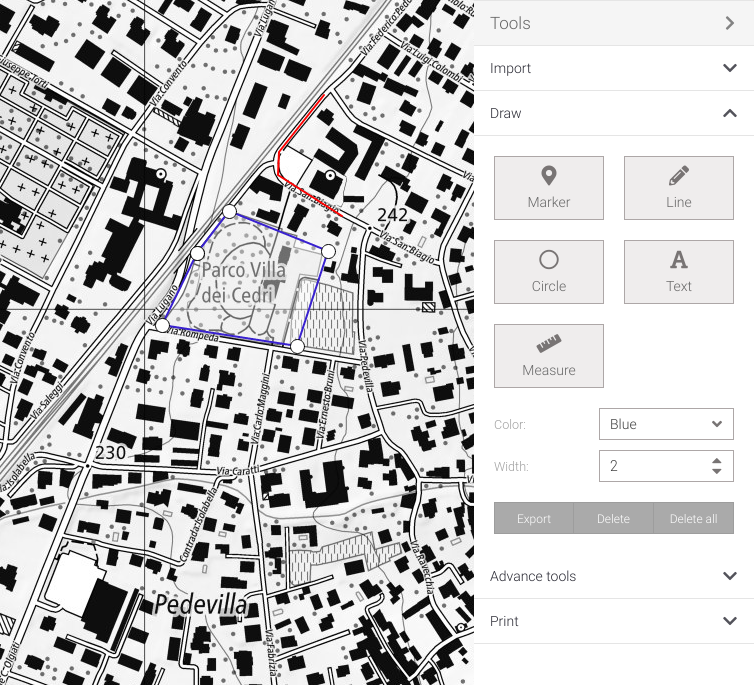
Fig. 105 Draw path / polygon
Tip
Multiple objects can be selected for editing by clicking on them and holding down the Shift key at the same time.
Add a circle
To add and a circle click on the right sidebar Tools ➔ Draw and select Circle. Click with the left mouse button on the desired place to position the center of the circle, move the mouse to obtain the desired radius and finally click again with the left mouse button to finish.
By selecting a circle - this will be marked with white dot on center - there is the possibility to modify it using the Color or Width (for the line width) drop-down menu that will appear below the drawing buttons.
To move the circle, hold down the left mouse button on it and drag it to the desired point, this will be positioned when you release the button.
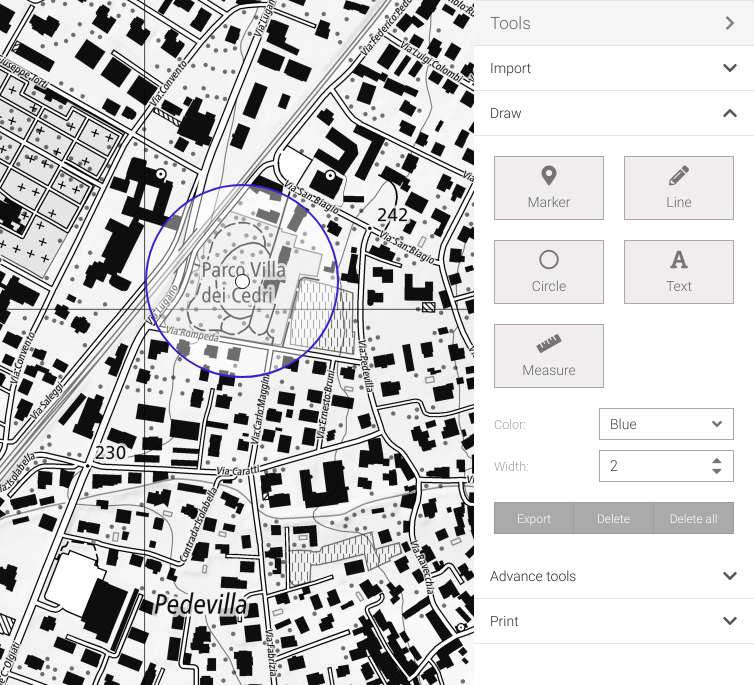
Fig. 106 Draw circle
Tip
Multiple objects can be selected for editing by clicking on them and holding down the Shift key at the same time.
Add a text
To add text click on the right sidebar Tools ➔ Draw and select Text. Click the left mouse button on the desired location to add text.
By selecting a text - this will be marked with a white dot in the center - there is the possibility to modify it using the Color, Icon and Size drop-down menus that will appear below the drawing buttons.
To move text, hold down the left mouse button on it and drag it to the desired point, this will be positioned when you release the button.
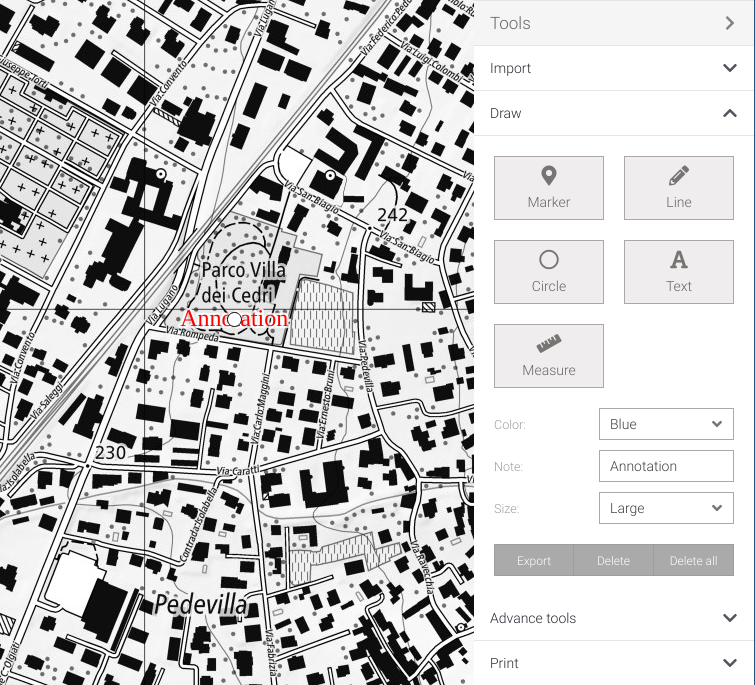
Fig. 107 Draw text
Tip
Multiple objects can be selected for editing by clicking on them and holding down the Shift key at the same time.
Measure
To perform a measurement click on the right sidebar Tools ➔ Draw and select Measure. Click with the left mouse button to start the path, continue clicking to add segments and double-click to end the path. If you finish the path at the starting point it will create a surface. With a single segment, the circumference will be displayed with a radius of the size of the segment itself. Distance and area measurement and profile are automatically displayed. While creating the path you can use the Delete key on the keyboard to delete the last point.
Positioning over the measure figure, if selected, a blue dot will appear following the movement of the mouse and by clicking on it you can add a new vertex. All vertices can be moved by holding down the left mouse button and dragging the cursor in the desired direction. To remove a vertex, click on it with the left mouse button while holding down the Alt key on the keyboard.
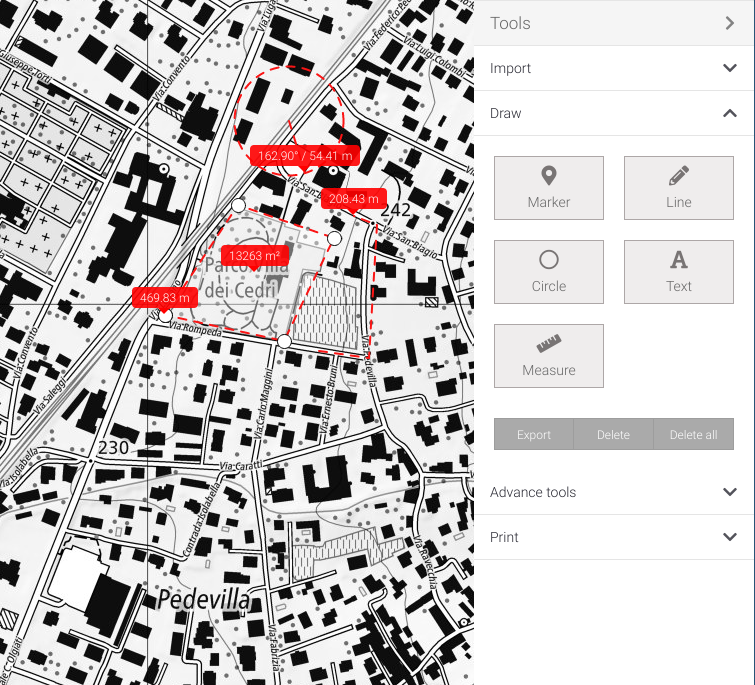
Fig. 108 Draw measure
Delete a drawn object
To delete a drawn object, select it - his will be marked with white dot on center - by clicking with the left mouse button and clicking the Delete button found under the buttons (Fig. 109) or by pressing the Delete key on the keydboard.
By clicking on the Delete all button (Fig. 109) all objects are deleted.

Fig. 109 Delete/export drawing buttons
Tip
Multiple objects can be selected for deletion by clicking on them and holding down the Shift key at the same time.
Exporting a drawing
To export the drawing, click on the sidebar on the right Tools ➔ Draw and press the Export button located under the buttons (Fig. 109). This will export the drawing to your computer in KML format.
Warning
Importing an exported drawing with the KML Import tool it will not be able to be edited.
Compare
It’s possible to compare two different levels. To access this tool click on the right sidebar Tools ➔ Advanced tools and select Compare (Fig. 110).
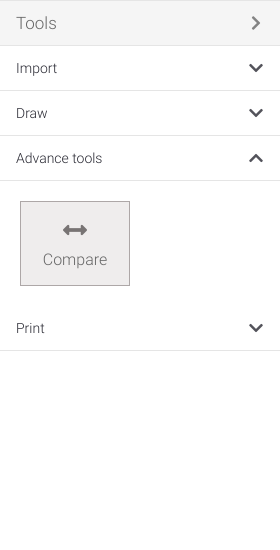
Fig. 110 Advanced tools
The layer that is in the first position in the box of selected layers will appear on the left while all others on the right. The comparison can be made by moving the green slider (Fig. 111) left and right with the mouse.
To disable this tool click again on the right sidebar Tools ➔ Advanced Tools and click Compare toggle button.
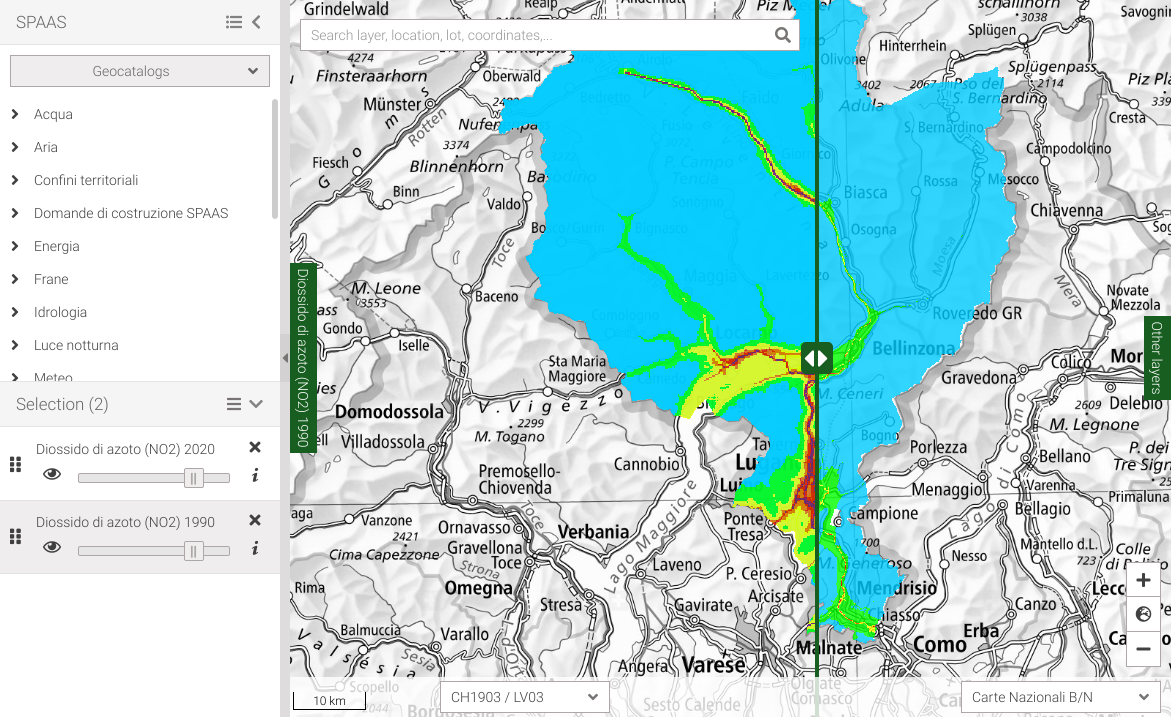
Fig. 111 Compare tool
OASI measurement network
It’s possible to view the measurement network by location of a specific domain in a georeferenced way. To access this function, click on the sidebar on the right Tools ➔ OASI measurement network (Fig. 112).
To display a measurement network select:
a Date range in which you want to see the situation of the measurement network,
a domain from the Select a domain drop-down menu,
a campaign from the All Campaigns drop-down menu (optional),
a parameter from the All parameters drop-down menu (optional),
and finally click on the Add Layer button to add the layer to the map.
The locations are displayed with a colored circle that changes depending on the selected domain. If a location is no longer in operation (dismissed) the circle will be crossed out. This information can be displayed using the layer information button.

Fig. 112 ‘OASI measurement network’ tool
Warning
Changing the Date range displays the location status in a given period, this also involves changing the location status (i.e., whether in operation or dismissed).
Print
The application allows a PDF document to be generated from the displayed map.
To access this feature click on the right sidebar Tools ➔ Print, or by clicking the button in the title bar. This will open a window (Fig. 113) where it will be possible to change the format/orientation of the pdf document via the Orientation drop-down menu, scale via the Scale drop-down menu, and whether to add the layers legend by checking the Legend field. The selected area - the one in the center - can be changed by moving the map by pressing the left mouse button and dragging the cursor in the desired direction. When the desired settings click on the Print button.
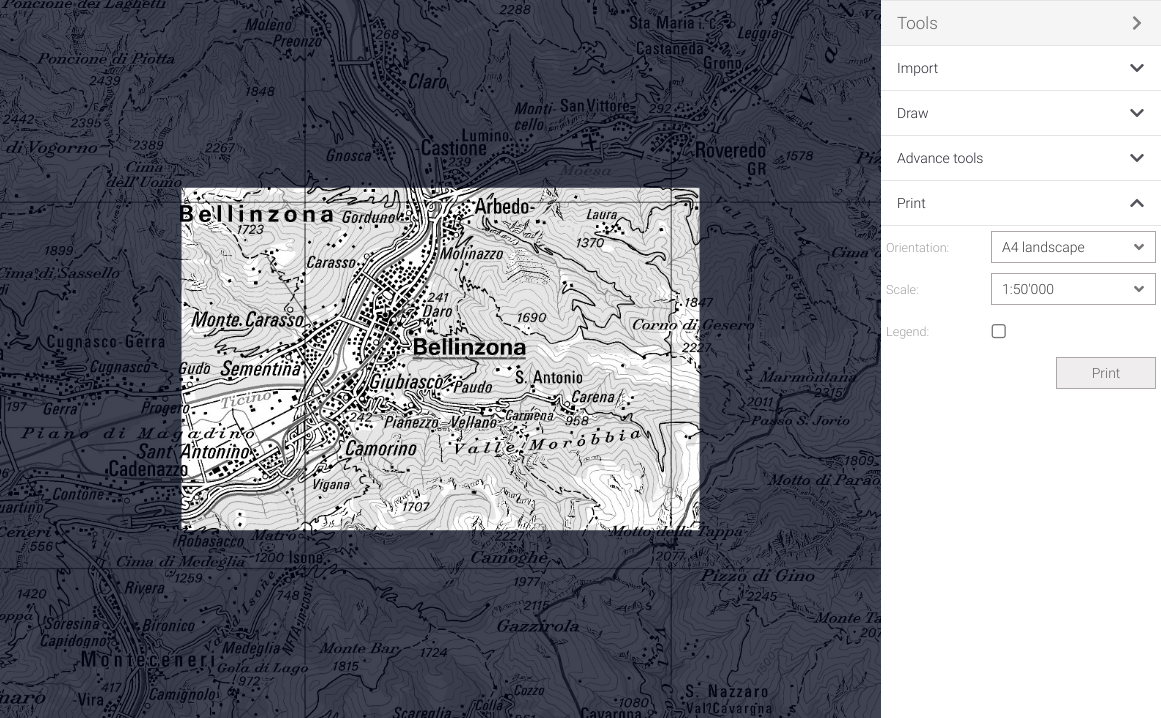
Fig. 113 Print map tool
Warning
The PDF document can be very heavy, its transmission via the internet can take a considerable time.
Warning
The selected layers that are marked with the symbol in the Selection box will not be present in the PDF document