Reports
Reports are tools, made ad hoc at the request of users, that allow data to be exported in a particular format not otherwise possible.
To access the list of available reports (Fig. 311) click on the icon in the side menu.
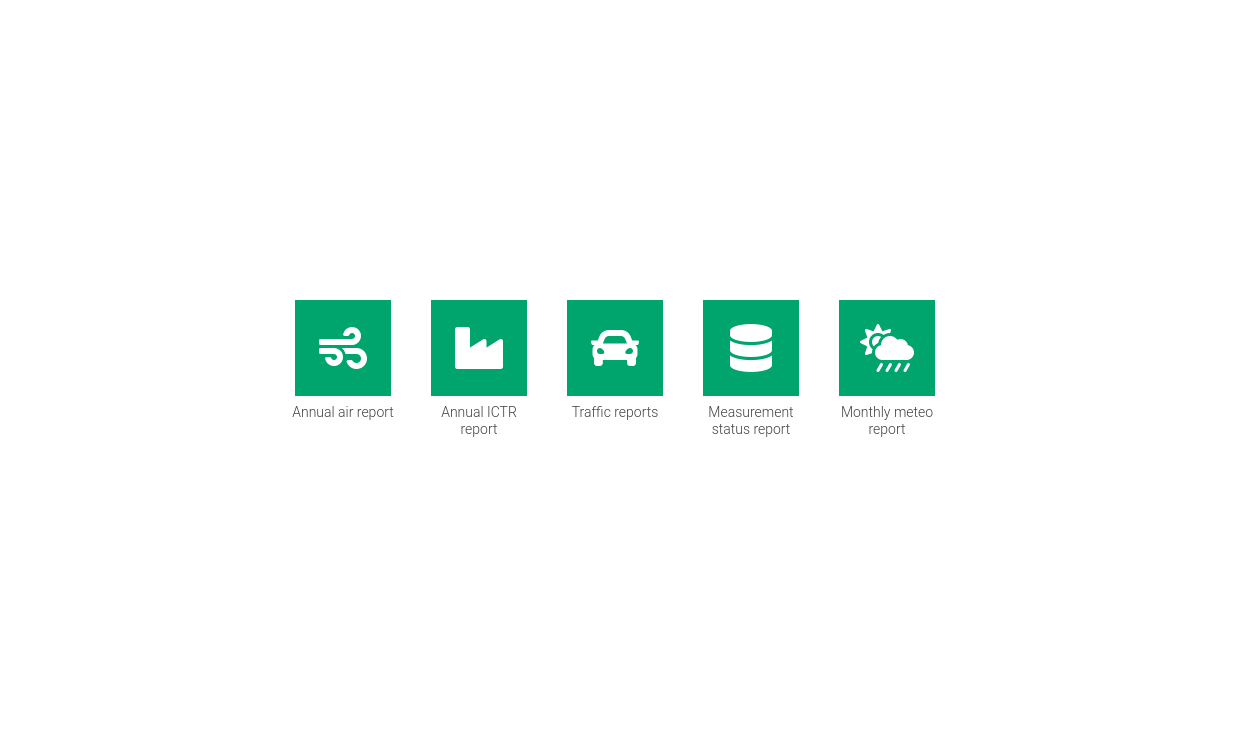
Fig. 311 List of reports
To request a creation of a new report using the Send feedback form by indicating as the Area of interest.
Note
Reports can be accessed based on the Authorizations a user has. Refer to the report-specific section of the manual to find out what permissions are required to access a particular report.
Annual air report
This report is used to have an overview of the data of the parameters NO2, NOx, O3, PM2.5, PM10 and SO2 of some locations where these parameters are measured.
To access this tool, click on the icon in the side menu and then click the button.
In the view (Fig. 312) will list all locations for which the data may be requested.
Choosing one or more locations from the list by clicking on the relevant checkbox will activate the Export button that once clicked will generate the report in .xls (Excel) format.
It’s possible to export all data at good and raw status (Table 6) or only those, also at good status, but validated by an operator (HQC) by activating/deactivating the checkbox All statuses. If the checkbox Yearly is activated, only the year of the start date of the date range will be taken into consideration so the data taken into consideration will start from 01.01 to 31.12. With the checkbox Round values the data will be rounded to the unit.
To return to the list of reports (Fig. 311) click on the button.
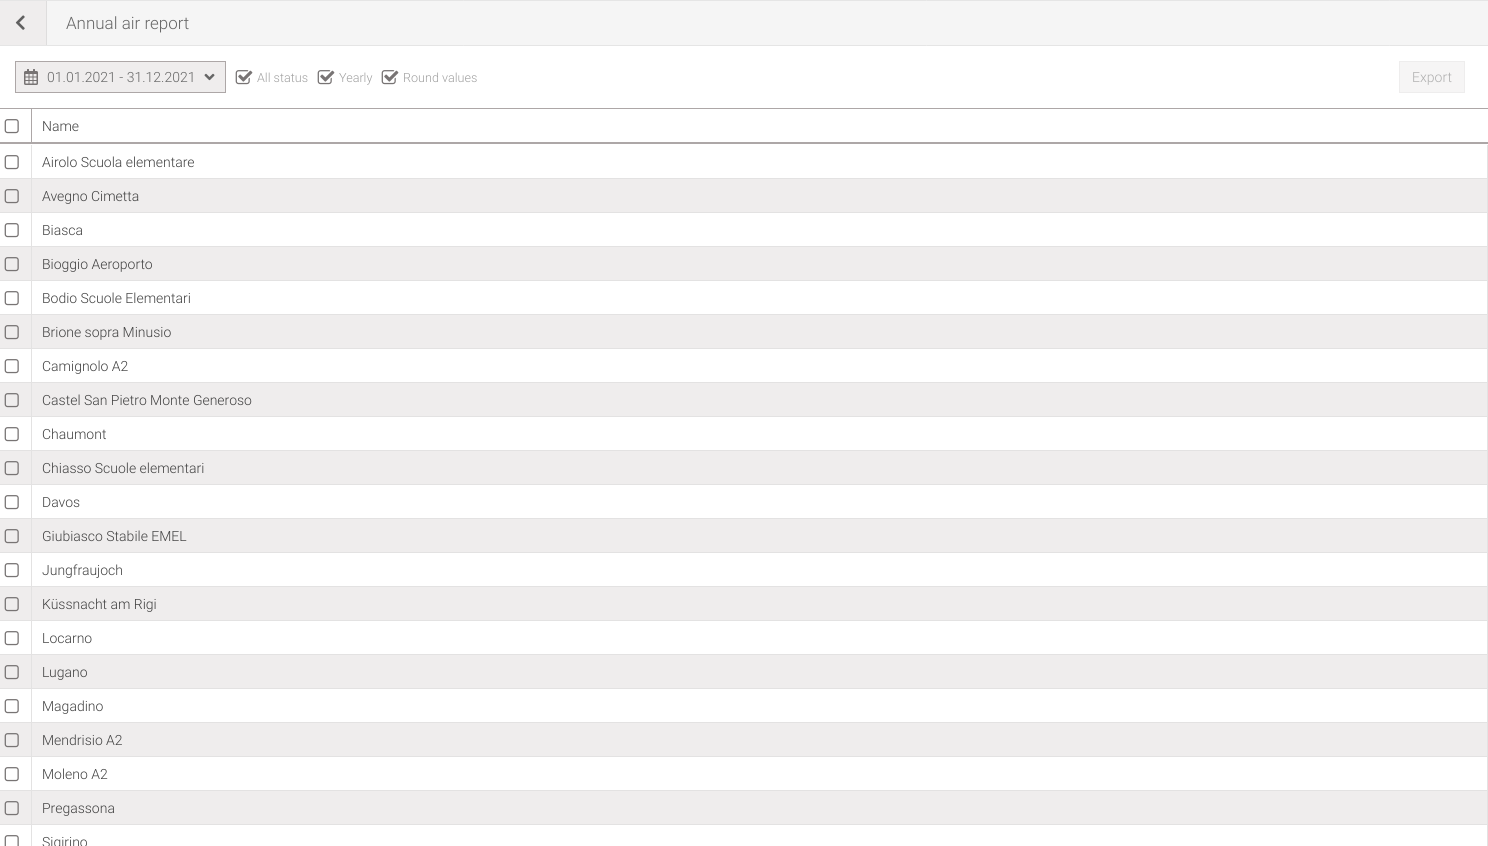
Fig. 312 Annual air report view
Annual ICTR report
This tool is used to export annual statistics regarding the Cantonal Waste to Energy Plant (Impianto Cantonale di Termovalorizzazione Rifiuti - ICTR).
To access this tool click on the icon in the side menu and then click the button.
Choosing a year from the drop-down menu will activate the Export button, which once clicked will generate the report in .csv format.
To return to the list of reports (Fig. 311) click on the button.
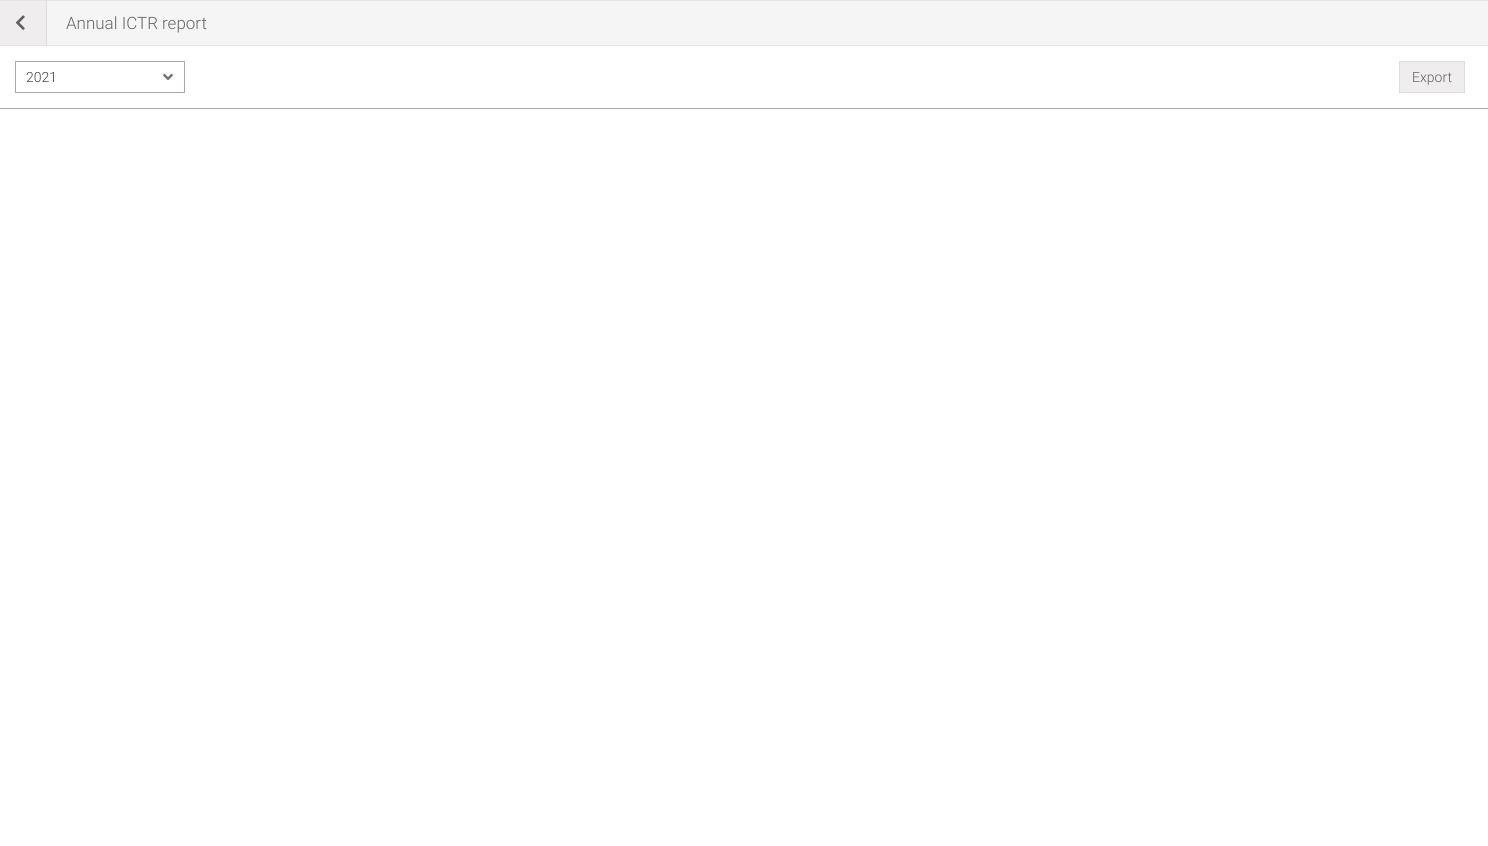
Fig. 313 Annual ICTR report view
Traffic reports
Three types of reports can be generated:
annual traffic counts, in
.pdfformat, that are published on the related oasi website Traffic Counts page,- The annual traffic counts, in
.csvformat, which include the following types: OPM: annual counts for morning peak time
OPS: annual counts by evening peak hour
TFM: annual counts by average weekday traffic
TGM: annual counts by average daily traffic
- The annual traffic counts, in
the metadata related to the platforms (or loops), in
.pdfformat.
To access this tool click on the icon in the side menu and then click the button.
In the view (Fig. 314) will list all locations, once a campaign is selected from the drop-down menu, for which the report may be requested. For the annual accounts, it’s also mandatory to choose a group type (total vehicles, light vehicles, bicycles, etc.) for create the report.
Choosing one or more locations from the list by clicking on the relevant checkbox will activate the Export button that once clicked will generate the desired report.
Through the first drop-down menu it’s possible to choose the type of report one want to generate by choosing between , and , while with the second you can choose the year whose data you want (available only with the Counts PDF/CSV report type). With the Location filter field, it’s possible to filter locations by ID code or by town name.
To return to the list of reports (Fig. 311) click on the button.
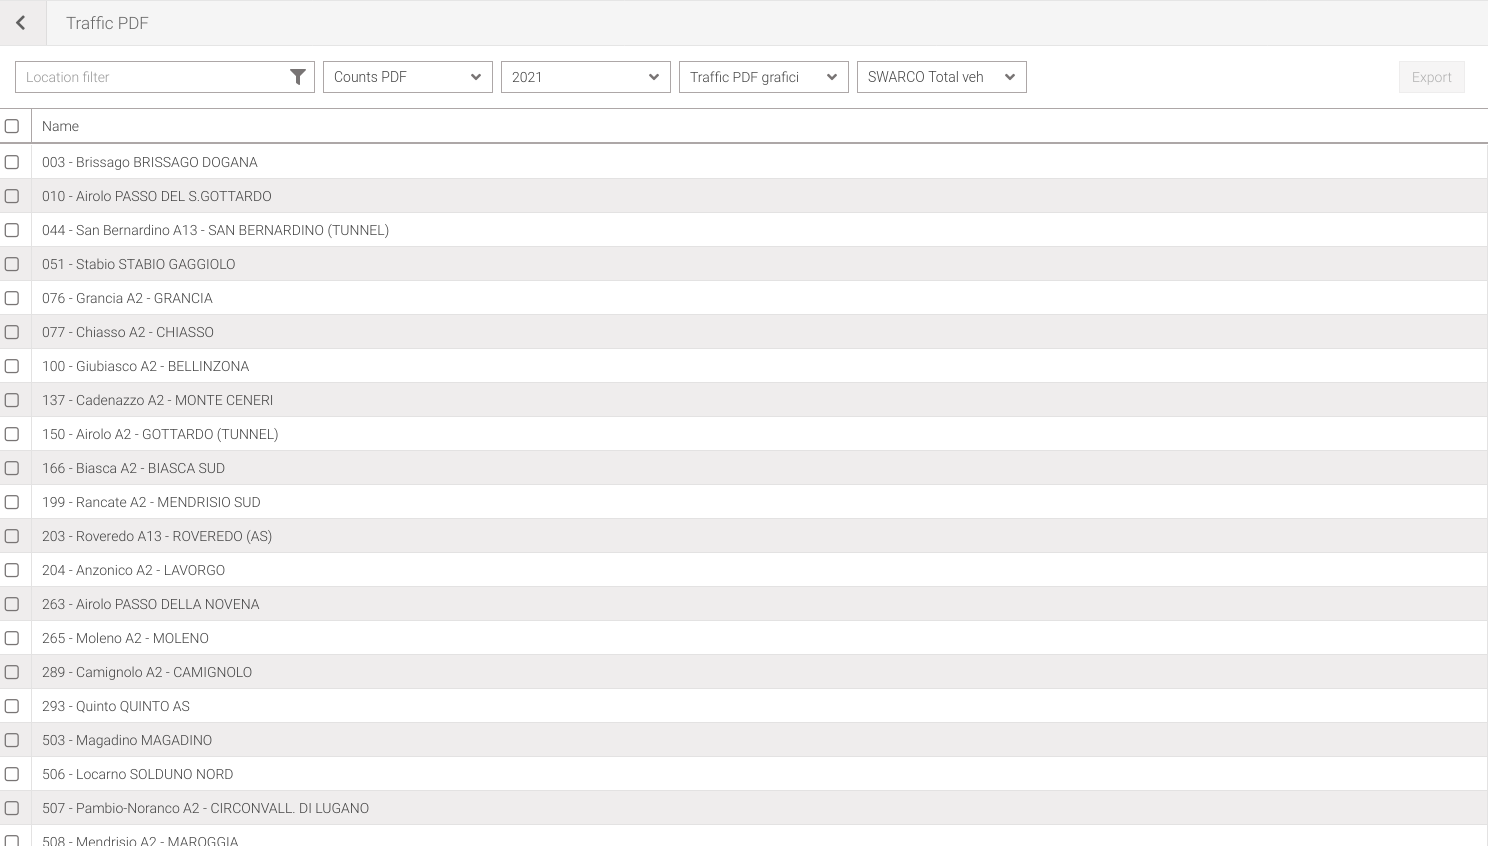
Fig. 314 Traffic PDF view
Measurement status report
This tool is used to export statistics regarding the status of measurements.
To access this tool click on the icon in the side menu and then click the button.
Choose a period and a domain, once click the Export button it will generate the report in .csv format.
If no domain is selected it will generate the report with all domains in which user have permission, in this case it’s possible to select at most one month as the period. On the other hand, if a domain is selected, a maximum of one year of data can be exported.
To return to the list of reports (Fig. 311) click on the button.
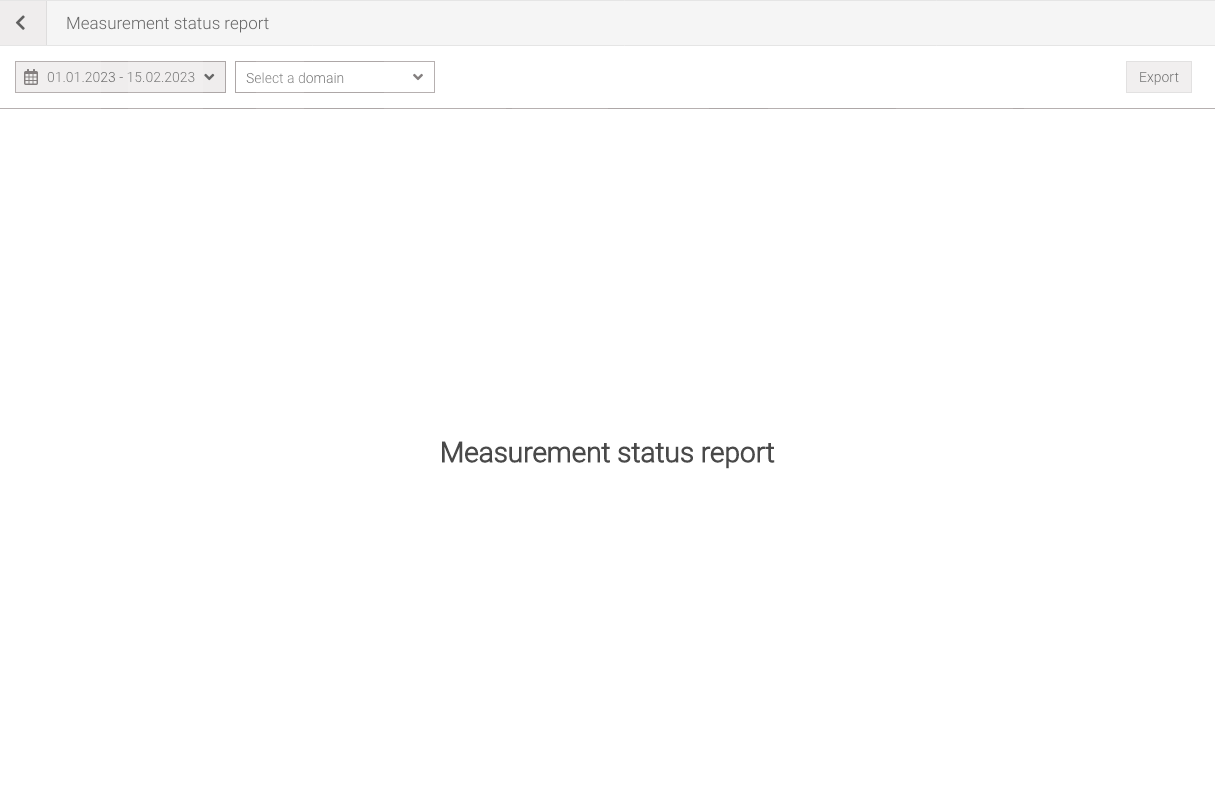
Fig. 315 Measurement status report view
Monthly meteo report
This tool is for doing checks on weather data.
To access this tool, click on the icon in the side menu and then click the button.
Choose a period and a campaign, once click the Export button it will generate the report in .csv format.
A maximum of one year of data can be checked.
To return to the list of reports (Fig. 311) click on the button.
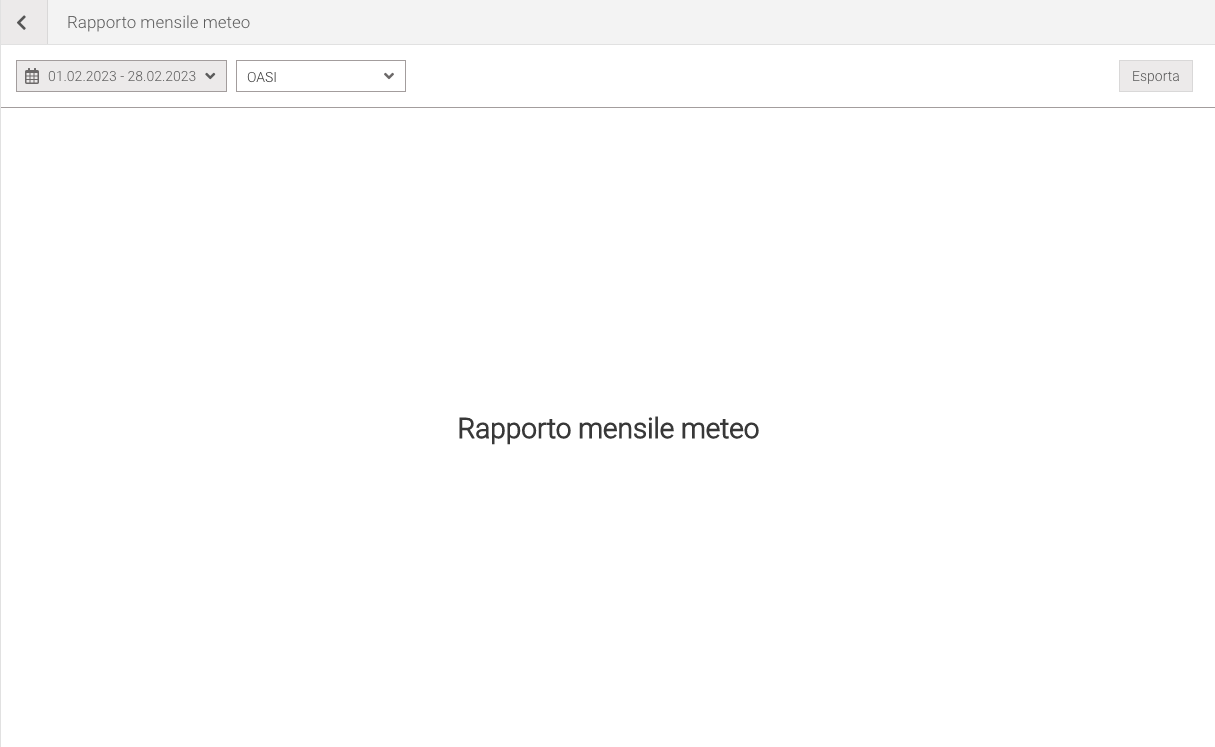
Fig. 316 Monthly meteo report view