Quality control
The oasi information system handles environmental data from very different areas (air pollution, noise pollution, electrosmog, meteorology, traffic,…). To ensure proper analysis and reliable information of this huge amount of data, the concept of quality control assumes a key role.
The aim is to apply a single quality control system to all data managed through the oasi system, regardless of the type of data (air, noise,…) and their operator. At the same time, the system makes it possible to take advantage of the many years of experience of the people responsible for the data in the various departments in charge of environmental observation.
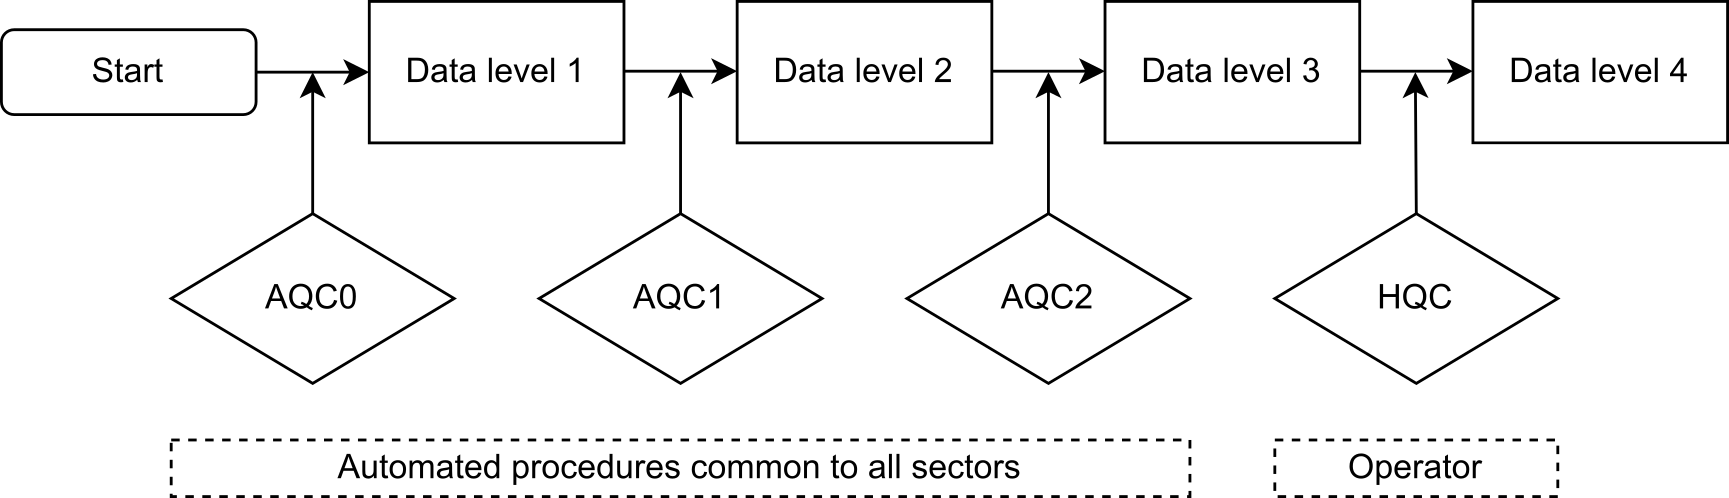
Fig. 289 Quality control scheme
For this reason, a quality control system with a modular architecture has been implemented (Fig. 289). It consists of a chain of automatic quality controls (automatic quality control - AQC) and a final manual quality control (human quality control - HQC), performed by the data responsibles that checks them and sets the final quality level.
New data acquired from the information system are subjected daily to automatic checks imposed by the system or chosen by the responsible user.
A first quality check (AQC0) is at the level of relevance of the measurement, so no data processing is intended. It checks whether the recorded values of a certain entered parameter are relevant (physical limit); as an example, it’s not possible to have air temperatures exceeding 100°C. No statistical test is carried out on the level 1 data.
From the level 1 data (raw data), several quality checks (AQC1) can be performed, automatically by the information system, early in the morning so that any malfunctions can be recognized quickly. If present, these checks are configured by the responsible and are normally chosen individually for each device. The tests performed at this level are listed in Table 5.
AQC1 test |
Description |
|---|---|
Availability |
Verifies that the time series of a given parameter reaches a minimum level of completeness. |
Range |
Minimum and maximum values are set for each parameter and measurement system, determined on the basis of historical data series. |
Step |
It involves identifying for each parameter the maximum jump (in absolute value) between two consecutive measurements. |
Daily persistency |
It checks that the standard deviation on one day’s values is not less than a given threshold. This could be an indication of malfunctioning of the device. |
Values persistency |
Test function to check whether an device continues to provide a stable signal, i.e., the same value from past ones. This could be an indication that the device is malfunctioning and could occur, for example, when the sensitivity of a sensor becomes insufficient. |
All of these tests (AQC0 and AQC1) can be set in Palma via the Thresholds page and supervised on the Alarms page.
The AQC2 testing procedures should consist of automatic routines capable of recognizing if the physiognomy of the trend of a given parameter shows anything suspicious while falling within the limits provided by AQC1. Unfortunately, to date these have not yet been implemented.
In order to make it understandable whether a given measurement has been validated by the automatic procedures (AQC) or by an operator (HQC), states have been introduced and are summarized in Table 6.
Status |
Quality control type |
Description |
|---|---|---|
0 |
AQC0 |
Raw data |
1 |
AQC0 |
Corrupted |
2 |
AQC1 |
Suspect |
3 |
AQC1 |
Good |
6 |
HQC |
Corrupted |
7 |
HQC |
Extraordinary (no statistics) |
8 |
HQC |
Good (correction applied) |
9 |
HQC |
Good (special event) |
10 |
HQC |
Good |
The states between 0 and 3 are those set by the automatic analysis procedures, while all others are manually assigned by the data responsibles. The AQC0 checks if they encounter a problem will put the data at corrupt state (1) otherwise it leaves it unchanged at raw state (0). In the second control step, i.e., AQC1, if they encounter problems they will put the data to either suspect state (2) or good state (3).
The final operator-made check (HQC) can be done through the Validation page, or by changing the measurement states directly in the charts.
The system also allows operators to enter maintenance done on the devices or measurement systems.
Alarms
Alarms occur when the threshold of an automatic procedure (AQC) for quality control is exceeded. In addition to being recorded in the system an email will be delivered to the responsible of the measurement system where such an alarm occurs.
To access this tool click on the icon and then in the side menu.
In this view (Fig. 290) will list all the alarms that have occurred.
Using the Filter location field the locations can be filtered by ID code or by town name. It’s also possible to filter by test type through the drop-down menu All test types.
Click on the icon it’s possible to switch to the data analysis with the location linked to the alarm preselected.
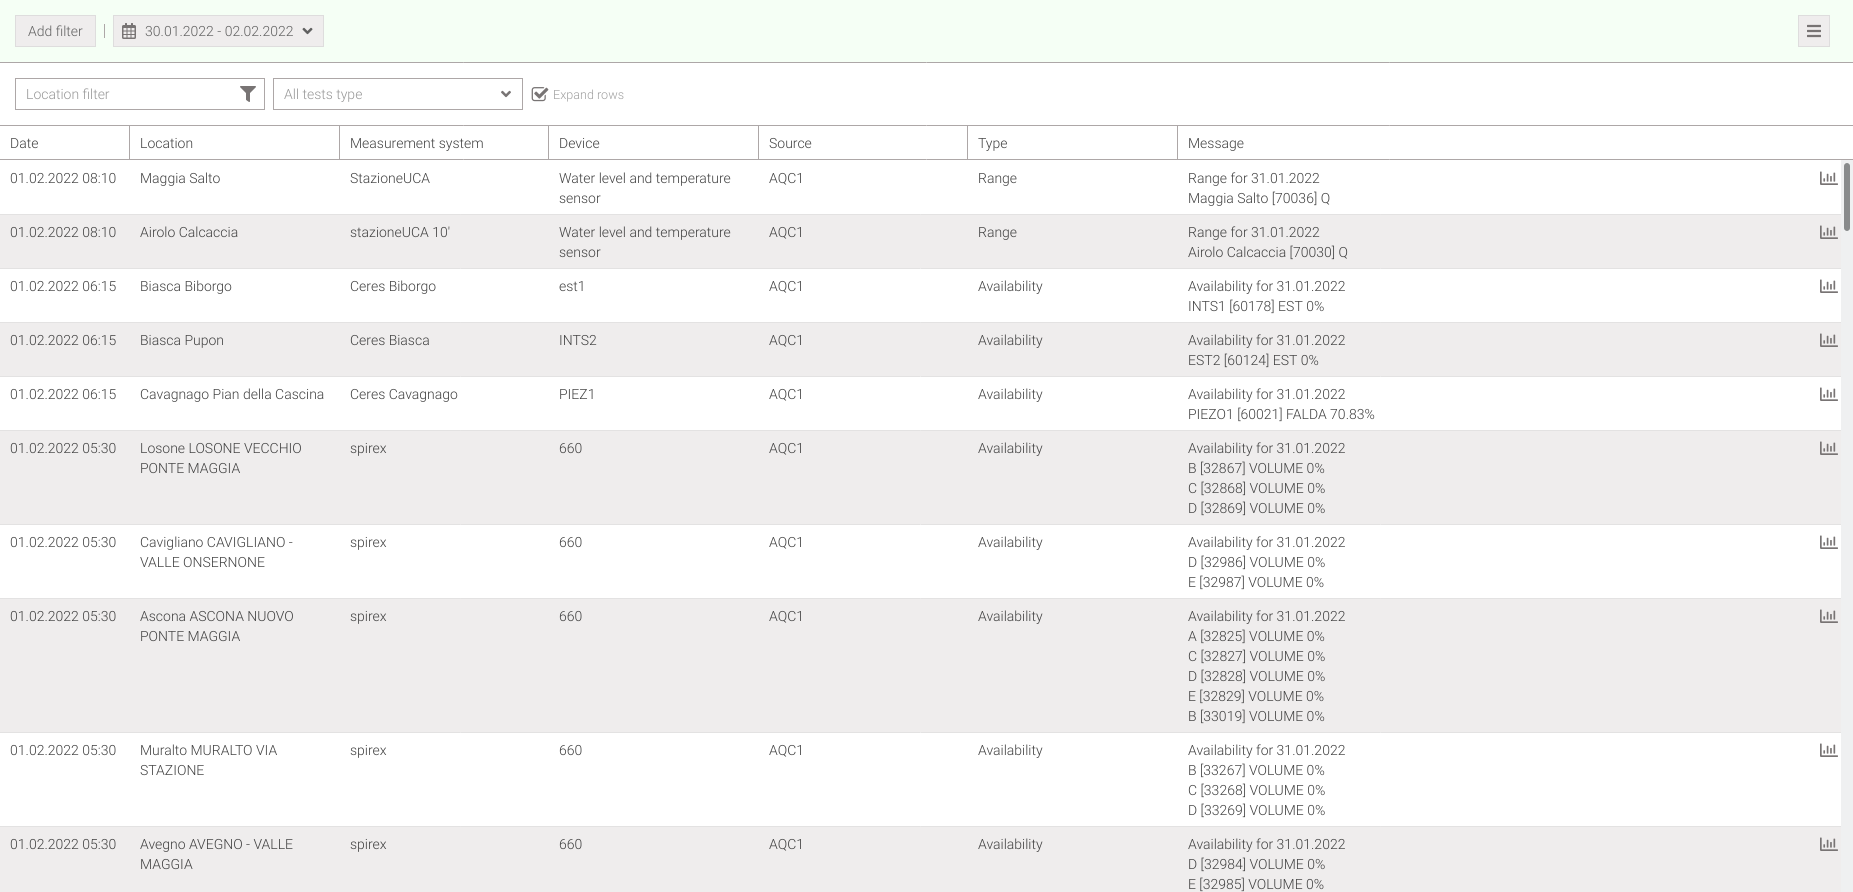
Fig. 290 List of alarms
Note
All listed alarms can be filtered thanks to the global filter.
Tip
In the alarm list, selected rows can be copied.
Print
It’s possible to print the alarms (Fig. 290) by clicking on the button in the header bar which will export the displayed table in .csv format.
The applied filters and sortings will also be kept in the exported file.
Maintenances
The maintenances are designed to record, if necessary, the different types of actions made by the responsible on the measurement system/devices during an inspection. Possible actions are summarized in Table 7.
Action |
|---|
Check |
Cleaning |
Calibration without sensitivity adjustement |
Calibration with sensitivity adjustement |
Substitution |
Repair |
Remove |
Software update |
Software control parameters changed |
Station/measuring instrument defects |
General comments |
Startup phase, ordinary and preventive maintenance |
Shutdown phase, ordinary and preventive maintenance |
Startup and shutdown, extraordinary and corrective maintenance |
Startup and shutdown due to electrical blackouts |
Exceeding due to maintenance during operation |
Exceeding due to management errors |
Exceeding due to special events |
Measuring instrument maintenance/calibration |
Startup and shutdown due to special events |
Filling |
To access this tool, click on the icon and then in the side menu.
In this view (Fig. 291) will list all the maintenances that have occurred.
Using the Filter location field the locations can be filtered by ID code or by town name. It’s also possible to filter by action type through the drop-down menu All Actions.
Click on the icon it’s possible to switch to the data analysis with the location linked to the selected maintenance, while by clicking on the icon will take to the measurement network with the location, measurement system and device (if present) pre-selected.
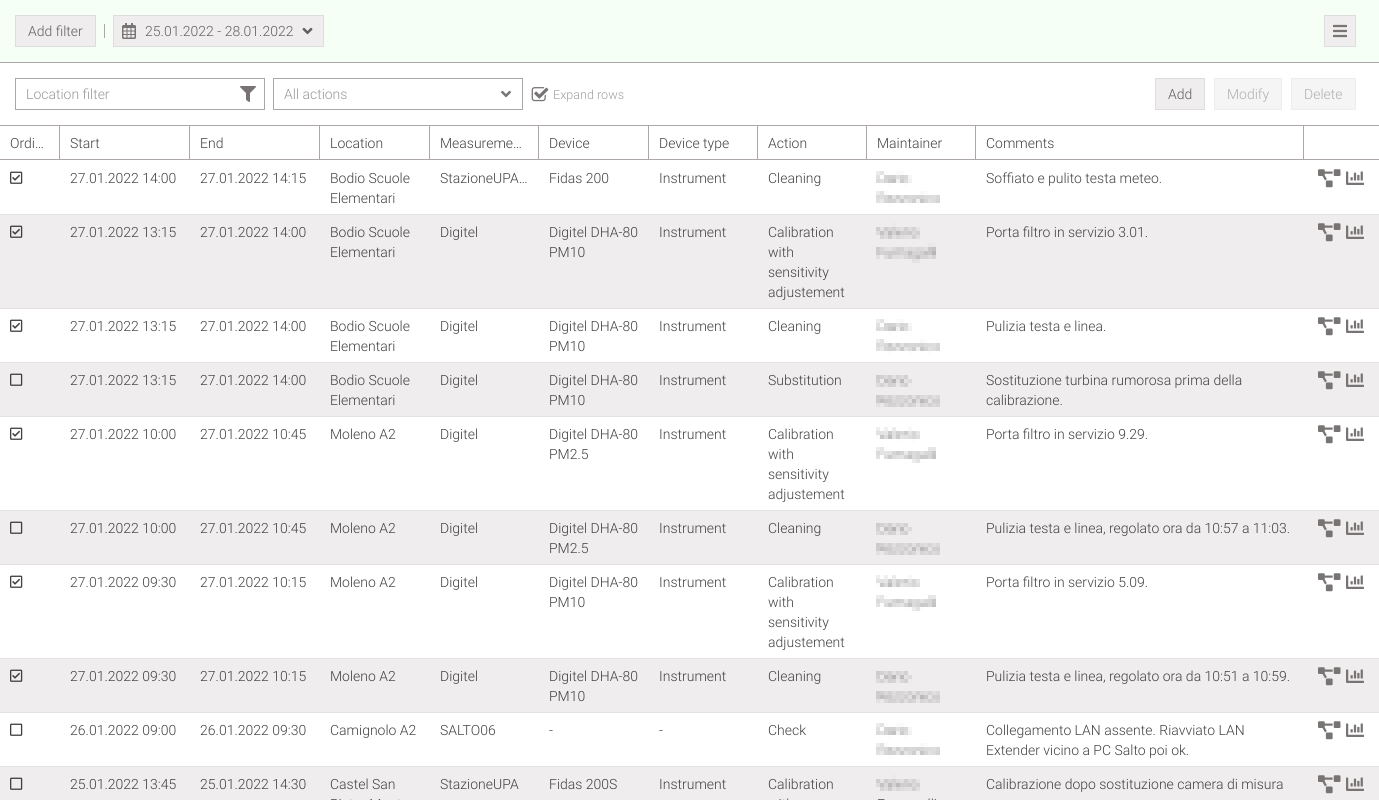
Fig. 291 List of maintenances
Tip
In the maintenance list, selected rows can be copied.
Add
To add a maintenance click on the Add button (Fig. 291). The addition is done in two steps via wizard:
Step 1: selecting the measurement system and maintenance start and/or end dates (Fig. 292)
To view the list of Measurement systems it’s necessary to select a Domain from the drop-down menu and then select the Location in this way the Measurement systems will appear. It’s also mandatory to select a Maintenance Start date in order to be able to continue with the insertion by clicking the Next » button.
It’s possible enter custom maintenance or via a pre-set maintenance protocol by simply clicking on the Custom or Protocol tabs.
To enter a custom maintenance (Fig. 293) it’s mandatory to choose the Type of action performed (see Table 7) while the other fields are optional. The Input value, Measured value and Sensitivity fields are usually used when doing a device calibration. After entering the desired fields click on the Add action button to add it in the list below.
Insertion via protocol (Fig. 294) allows to add maintenances quickly since the actions are all pre-set and responsible will simply have to check a box or add a value in a text field. Once this is done click on the Add action button to add it in the list below.
Actions inserted in the list can also be deleted by clicking on the icon.
Multiple maintenances can be added before clicking Done to record them.
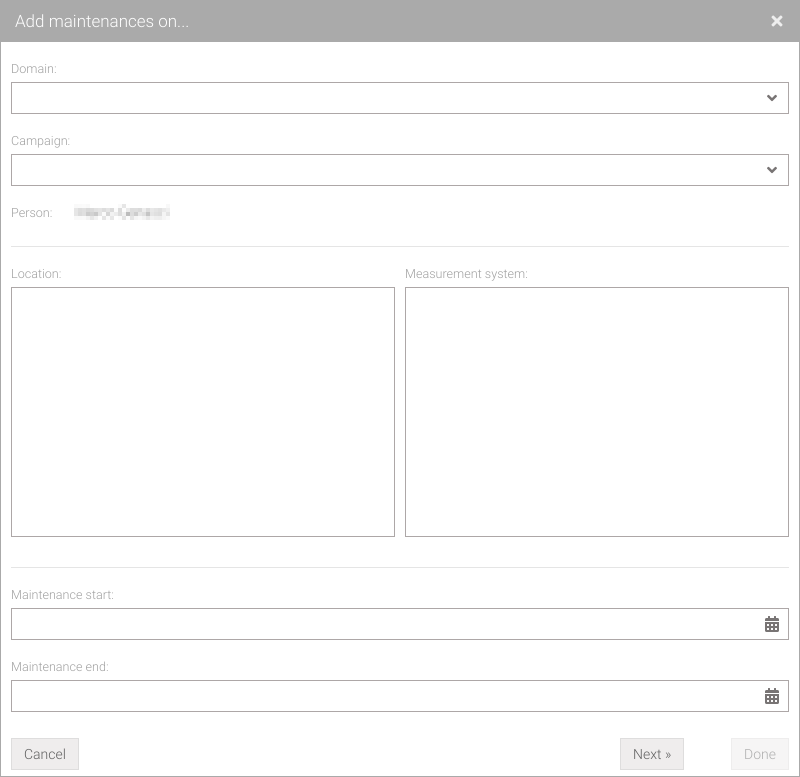
Fig. 292 Wizard: add maintenance
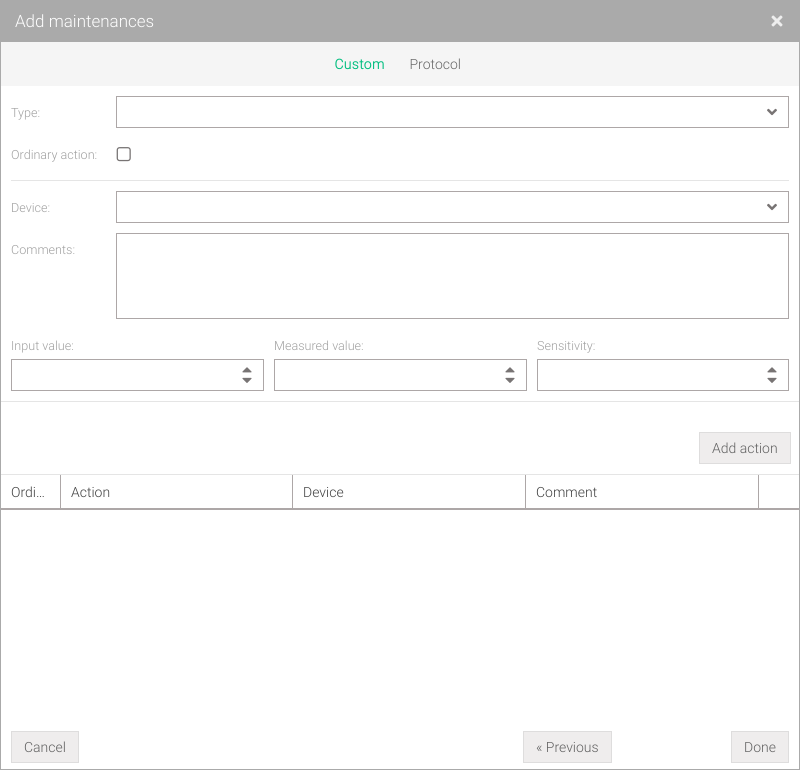
Fig. 293 Wizard: add custom maintenances |
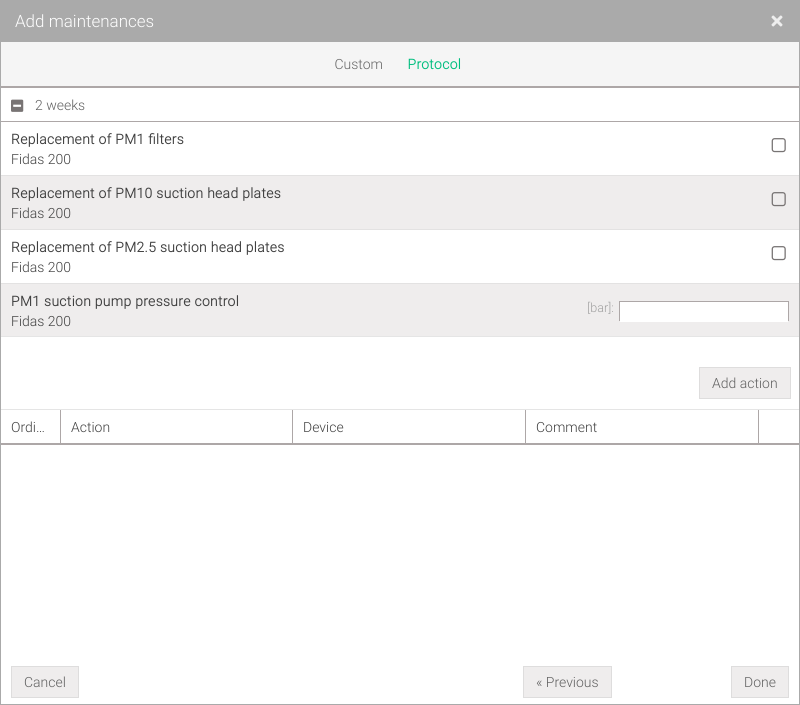
Fig. 294 Wizard: add maintenances from protocol |
Warning
Not all measurement systems have a maintenance protocol since it’s created ad hoc by administrators at the request of responsibles. One can request the creation of a protocol using the Send feedback form indicating as the Area of interest.
Note
Mandatory or incorrectly filled fields will be marked with red borders. Moving the mouse over the relevant field will give an explanation.
Modify
To edit a maintenance, one must select the desired maintenance from the list (Fig. 291) and click on the Modify button. This will open the same a window for adding (Fig. 295) with filled fields for the selected maintenance. Click Done to accept the changes.
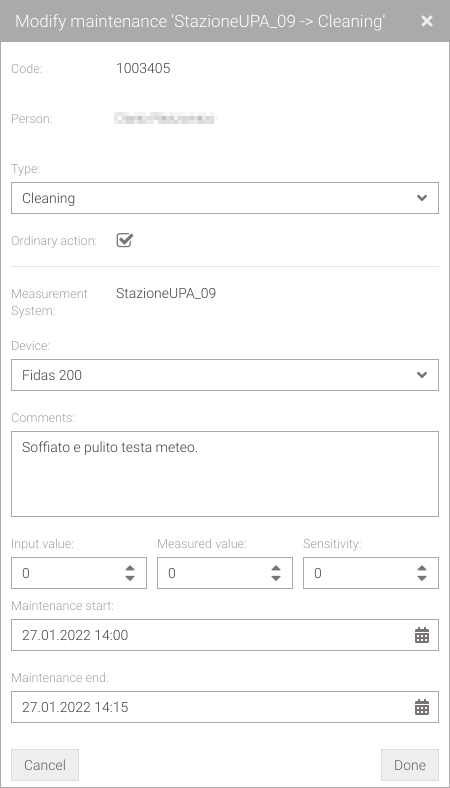
Fig. 295 Modify maintenance window
Note
Disabled fields (shown in a slightly lighter color) cannot be edited.
Warning
If more than one maintenance is selected, the modify button will be disabled. Make sure you have only one maintenance selected.
Remove
For removal select the desired maintenance from the list (Fig. 291) and click on the Delete button. Confirmation will be prompted if you really want to remove the selected maintenance.
Warning
If more than one maintenance is selected, the delete button will be disabled. Make sure you have only one maintenance selected.
Print
It’s possible to print the maintenances (Fig. 291) by clicking on the button in the header bar that will export the displayed table in .csv format.
The applied filters and sortings will also be kept in the exported file.
Thresholds
To perform automatic tests, defined in Table 5, parameters must have thresholds set. In the case of AQC1, one can also choose to apply a test only to a particular measurement point.
Two values can be set in the system for thresholds (threshold 1 and threshold 2), which change in meaning depending on the test. Table 8 specifies the meaning of the two thresholds depending on the type of test.
Test |
Threshold 1 |
Threshold 2 |
Alarm activated if |
|---|---|---|---|
Hard limit |
Minimum |
Maximum |
the value is not in the range of ‘Minimum’ and ‘Maximum’ |
Availability |
Minimum [fraction between 0 and 1] |
(not used) |
the number of measurements in a day does not reach the ‘Minimum’ fraction |
Range |
Minimum |
Maximum |
the value is not in the range of ‘Minimum’ and ‘Maximum’ |
Step |
(not used) |
Step value |
the difference between two continuous values exceeds +/- ‘Step value’ |
Daily persistency |
(not used) |
Standard deviation |
the standard deviation over the day is less than +/- ‘Standard deviation’ |
Values persistency |
Deviation |
Number of measurements [count] |
the ‘Number of measurements’ does not deviate from +/- ‘Deviation’ |
To access this tool click on the icon and then in the side menu.
In this view (Fig. 296) will list all the thresholds set in the system. The ‘*’ symbol in the Location and Measurement point columns stand for indicating that that threshold is applied for all systems that measure that particular Parameter.
Through the Filter location field, locations can be filtered by ID code or by town name. It’s also possible to filter by parameter type via the All parameters drop-down menu and by test type via the All tests drop-down menu.
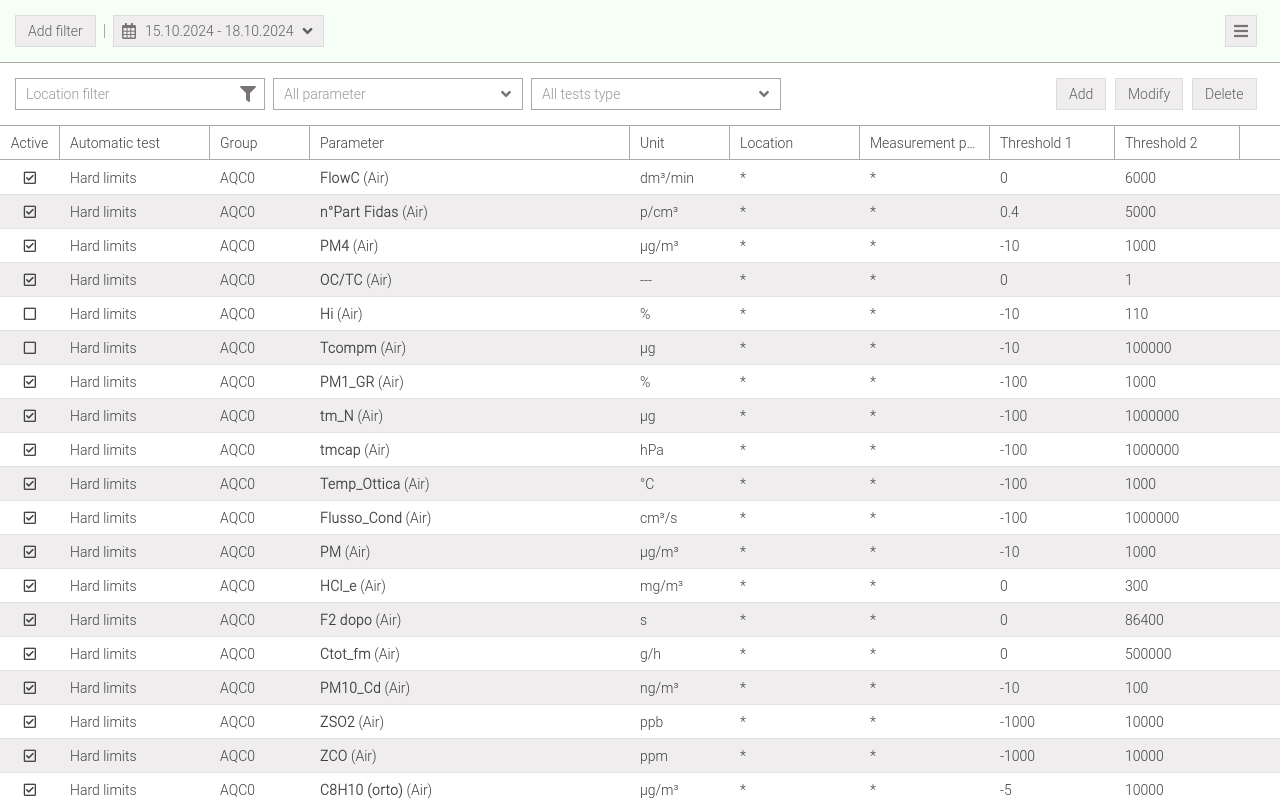
Fig. 296 List of thresholds
Tip
In the threshold list, selected rows can be copied.
Add
To add new thresholds for automatic tests click on the Add button (Fig. 296) where a window will open that allows them to be added (Fig. 297 and Fig. 298).
For tests that are part of the AQC0 category, thresholds are assigned to each measurement point that reveals that parameter. In contrast for all tests in the AQC1 category can be assigned to a single measurement point.
Click Done to add the threshold.
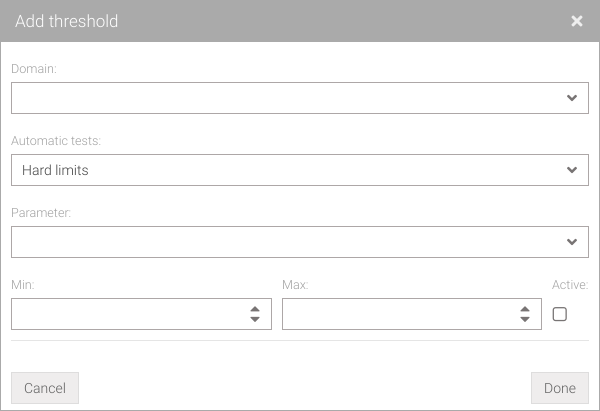
Fig. 297 Add thresholds for an AQC0 test |
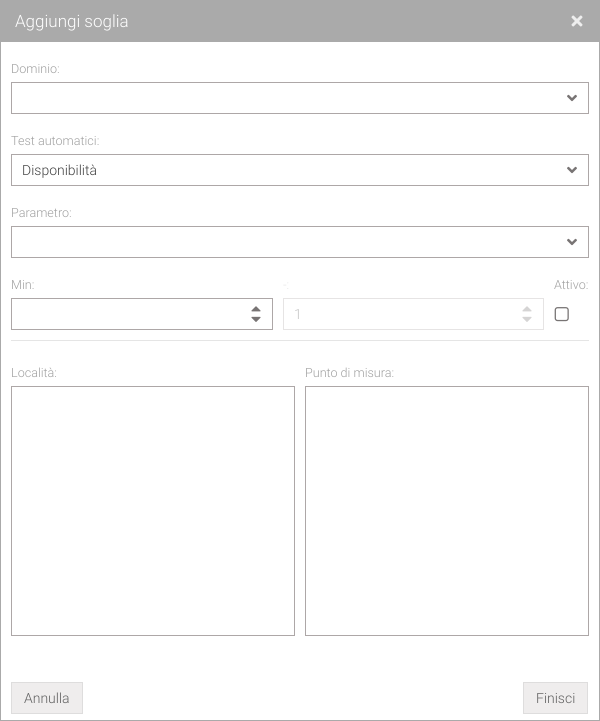
Fig. 298 Add thresholds for an AQC1 test |
Warning
If the Active checkbox is not selected the thresholds set for that given test will never be verified by the control system.
Note
Mandatory or incorrectly filled fields will be marked with red borders. Moving the mouse over the relevant field will give an explanation.
Modify
To edit a threshold, one must select the desired threshold from the list (Fig. 296) and click on the Modify button. This will open the same window for adding (Fig. 299) but with filled fields for the selected threshold. Click Done to accept the changes.
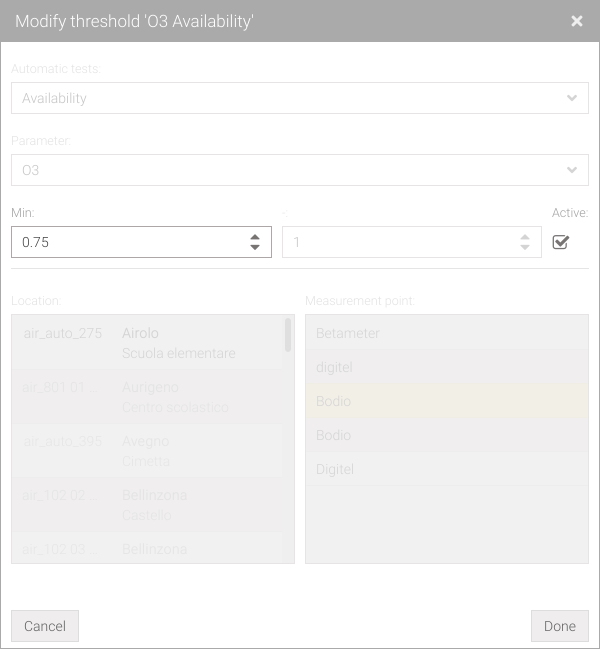
Fig. 299 Modify threashold window
Note
Disabled fields (shown in a slightly lighter color) cannot be edited.
Remove
For removal, select the desired threshold from the list (Fig. 296) and click on the Delete button. Confirmation will be prompted if you really want to remove the selected threshold.
Warning
Removing thresholds means that a particular test will no longer be run this could lead to not noticing malfunctions in the system.
Print
It’s possible to print the threshold (Fig. 296) by clicking on the button in the header bar which will export the displayed table in .csv format.
The applied filters and sortings will also be kept in the exported file.
Viasuisse
Viasuisse are a set of services that provide information on the viability of the Swiss road network.
Palma imports events from this service that can be helpful in checking measurements with suspicious values even if they are not detected by the automatic tests.
An event consists of the main message and any updates that follow if it changes over time, for example an update of the message or end date.
To access this tool click on the icon and then in the side menu.
The view (Fig. 300) will list all events that occurred once a location or coordinates has been entered in Search by location or coordinates, a Date range and the Radius within which to search. Events can also be filtered by road by choosing the desired one from the Road drop-down menu. It’s also possible to view this list in compact form (Fig. 301) by disabling the Expand rows checkbox.
If an event has changed over time it’s possible to view its history (Fig. 302) by clicking on the button.
By selecting one or more events (Ctrl + ) one can view them on the map (Fig. 303) by clicking on the Go to map button.
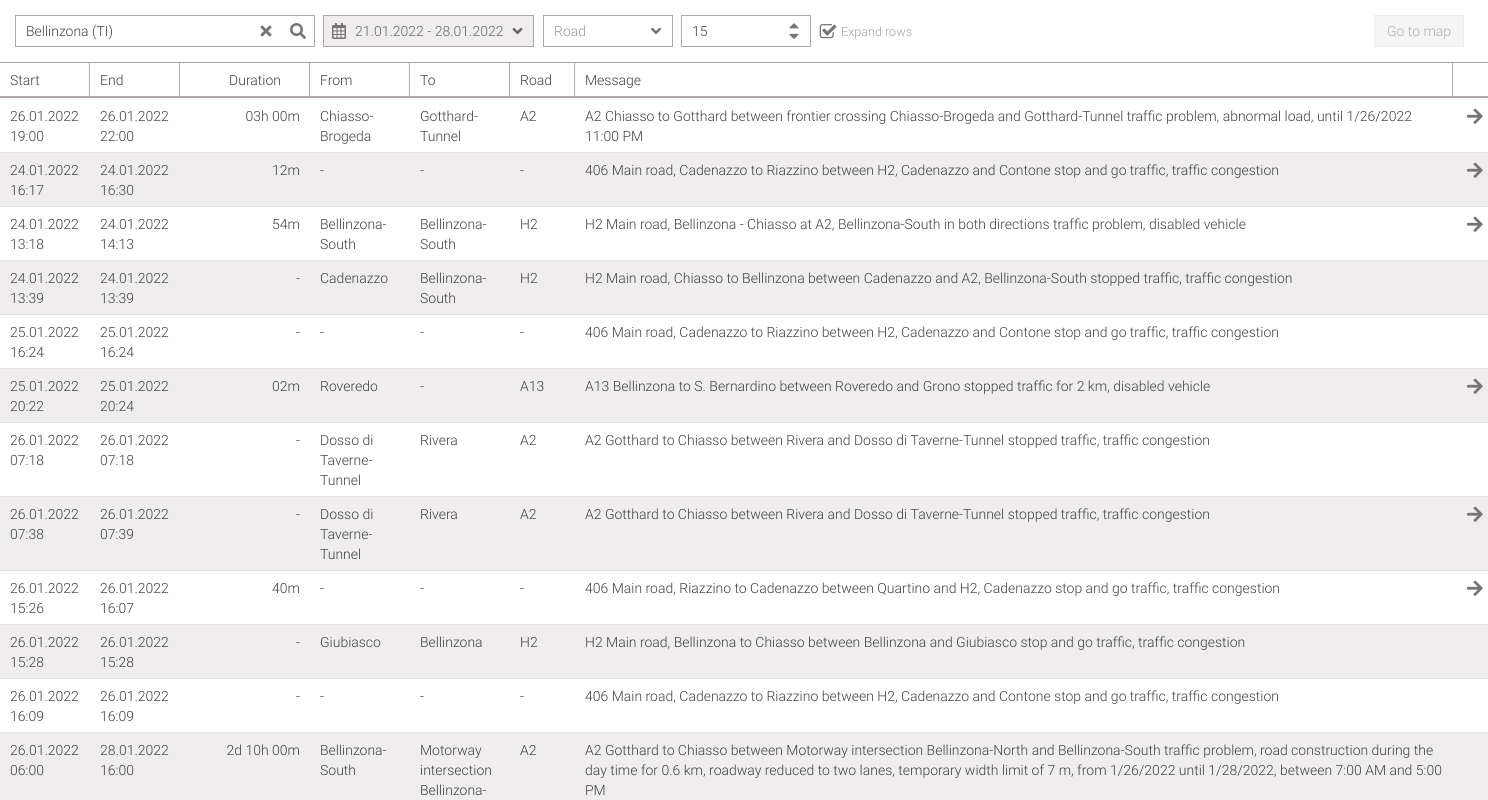
Fig. 300 Viasuisse events
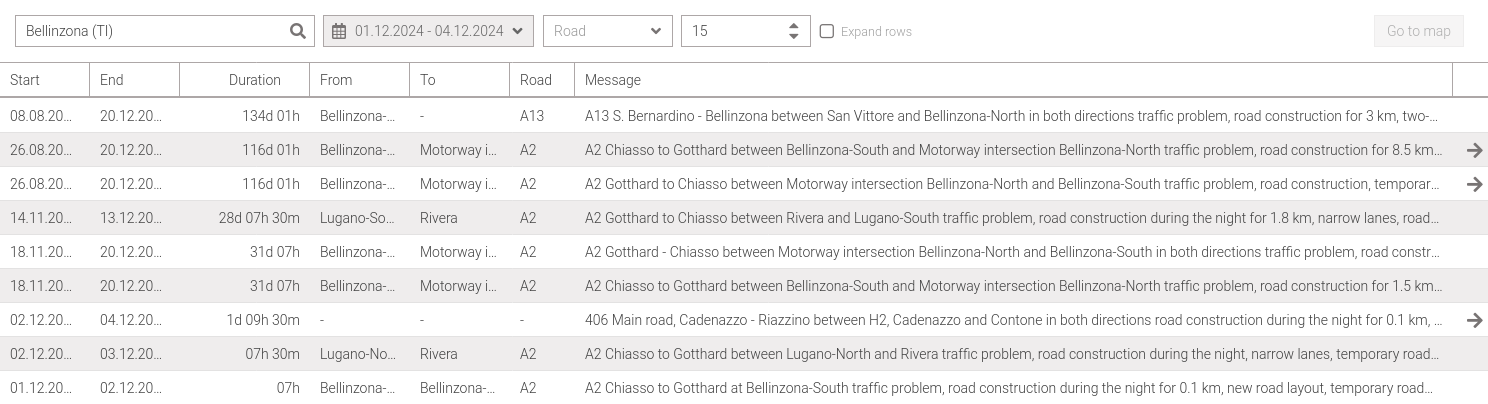
Fig. 301 Viasuisse events in compact form
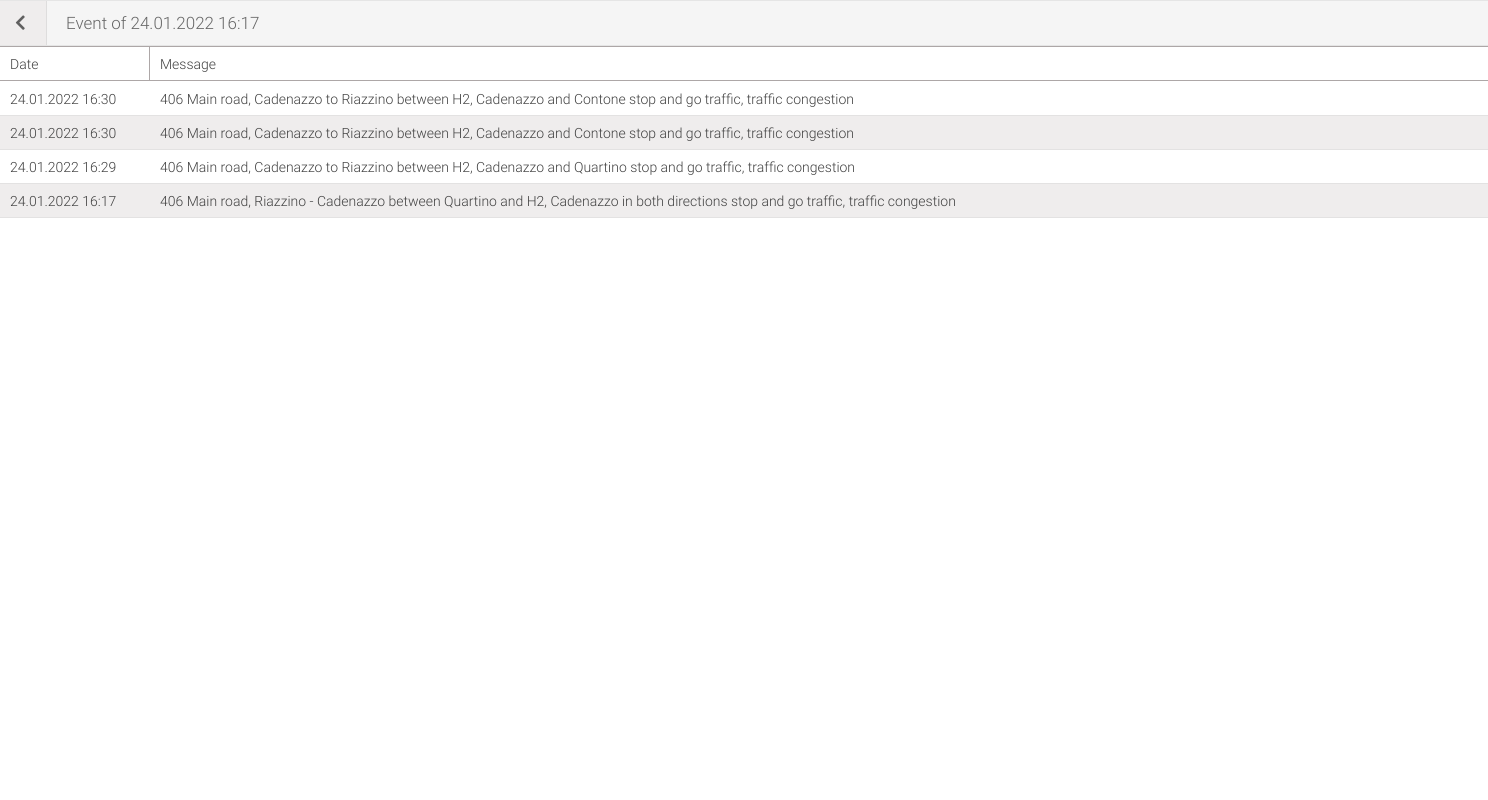
Fig. 302 History of an viasuisse event |
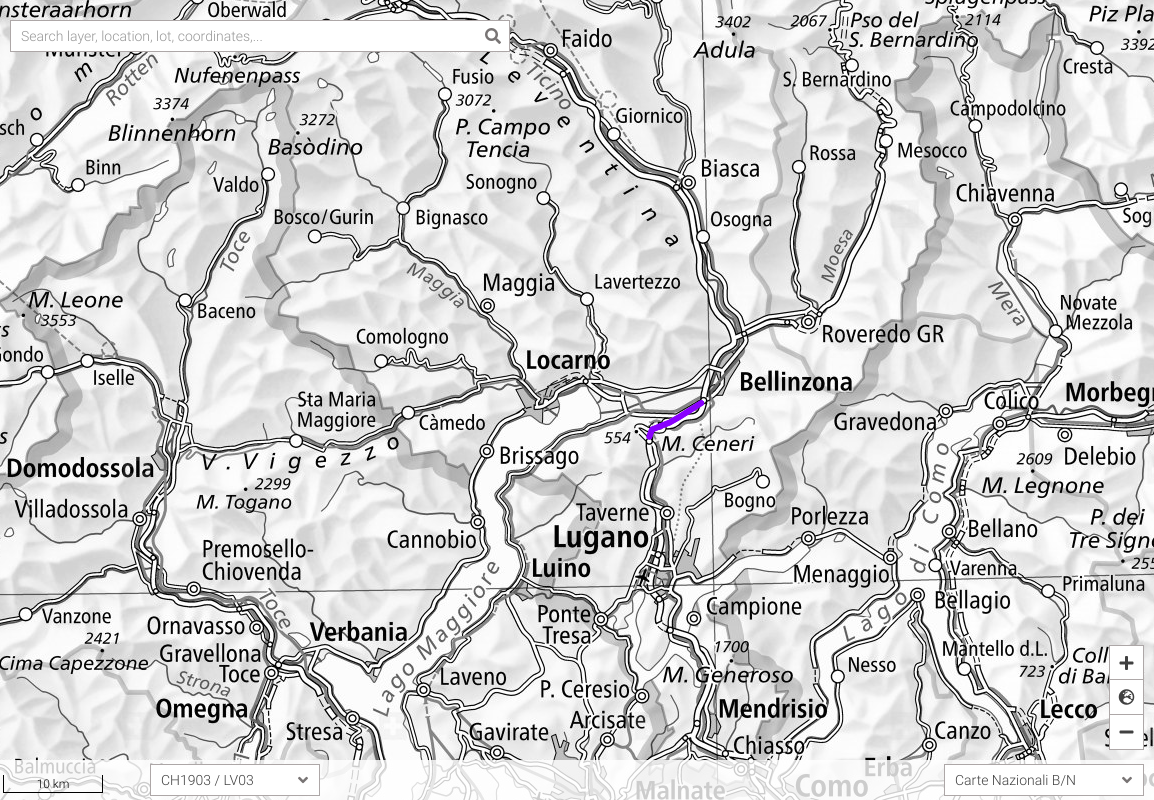
Fig. 303 Viasuisse event shown on the map |
Warning
The system receives Viasuisse data concerning only Canton of Ticino and on the A2 and A13 highway axes; data concerning other cantons are not present.
Tip
In both the event list (Fig. 300) and the event history list (Fig. 302), selected rows can be copied.
Print
It’s possible to print the viasuisse events (Fig. 300) by clicking on the button in the header bar which will export the displayed table in .csv format.
The applied filters will also kept in the exported file while the sorting will not.
Validation
This tool allows to get an overview of the status of data validation in addition to also doing validation. To access it click on the icon and then in the side menu.
Since the data to be analyzed for visualization can be many, even depending on the period chosen, initially the view appears with a empty table (Fig. 304). To be able to display data, choose from the drop-down menus a domain (Select a domain) and a campaign (Select a campaign). At this point all locations and their count of measurements will be listed (Fig. 305) that have been entered grouped by state (Table 6).
By default, only environmental parameter data is displayed. However, it is possible to view and consequently validate other types of parameters by selecting them from the dropdown menu.
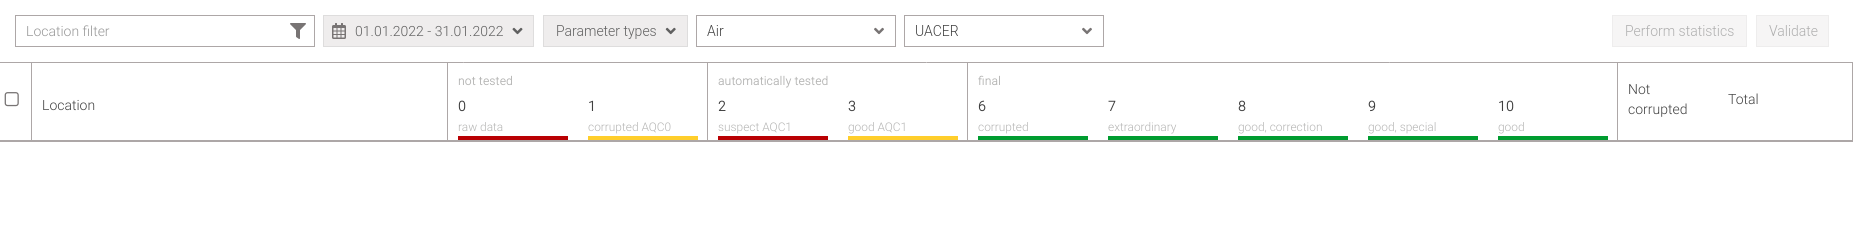
Fig. 304 Validation window
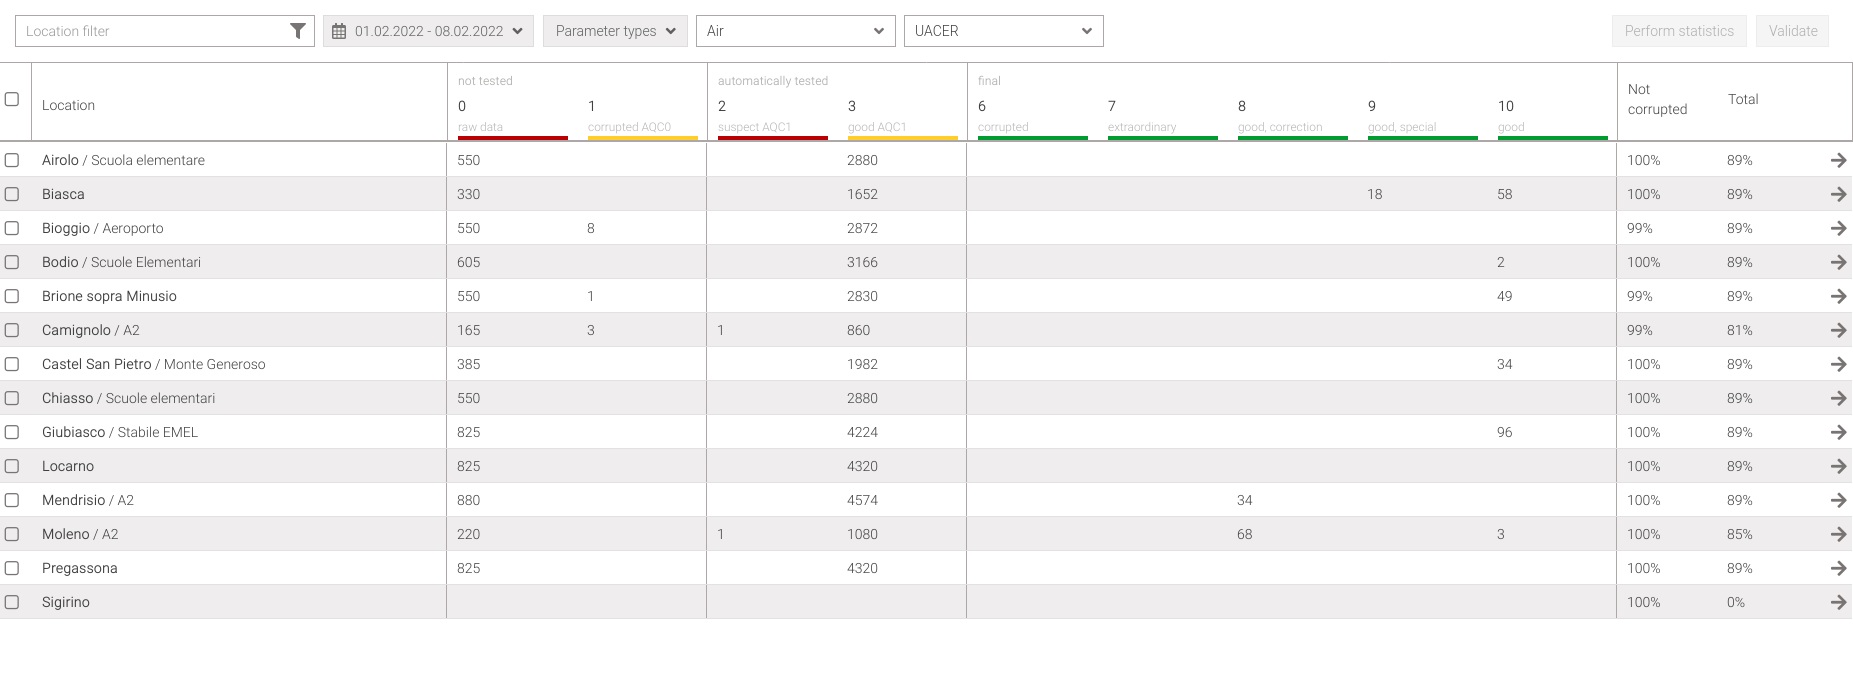
Fig. 305 Validation window by location
The Total column reports the percentage of measures that have been imported compared to those expected, while the Not Corrupted column reports the percentage of data that are not corrupted this means that their status is neither a 1 nor a 6. Hovering the mouse over a cell in these two columns will display a tooltip (Fig. 306 and Fig. 307) where the absolute values are shown.

Fig. 306 ‘Not corrupted’ column tooltip |
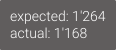
Fig. 307 ‘Total’ column tooltip |
It’s possible to view details of the measurements status for a location (Fig. 308) by clicking the button. This will display the same data but separated by parameter, measurement points and resolution.
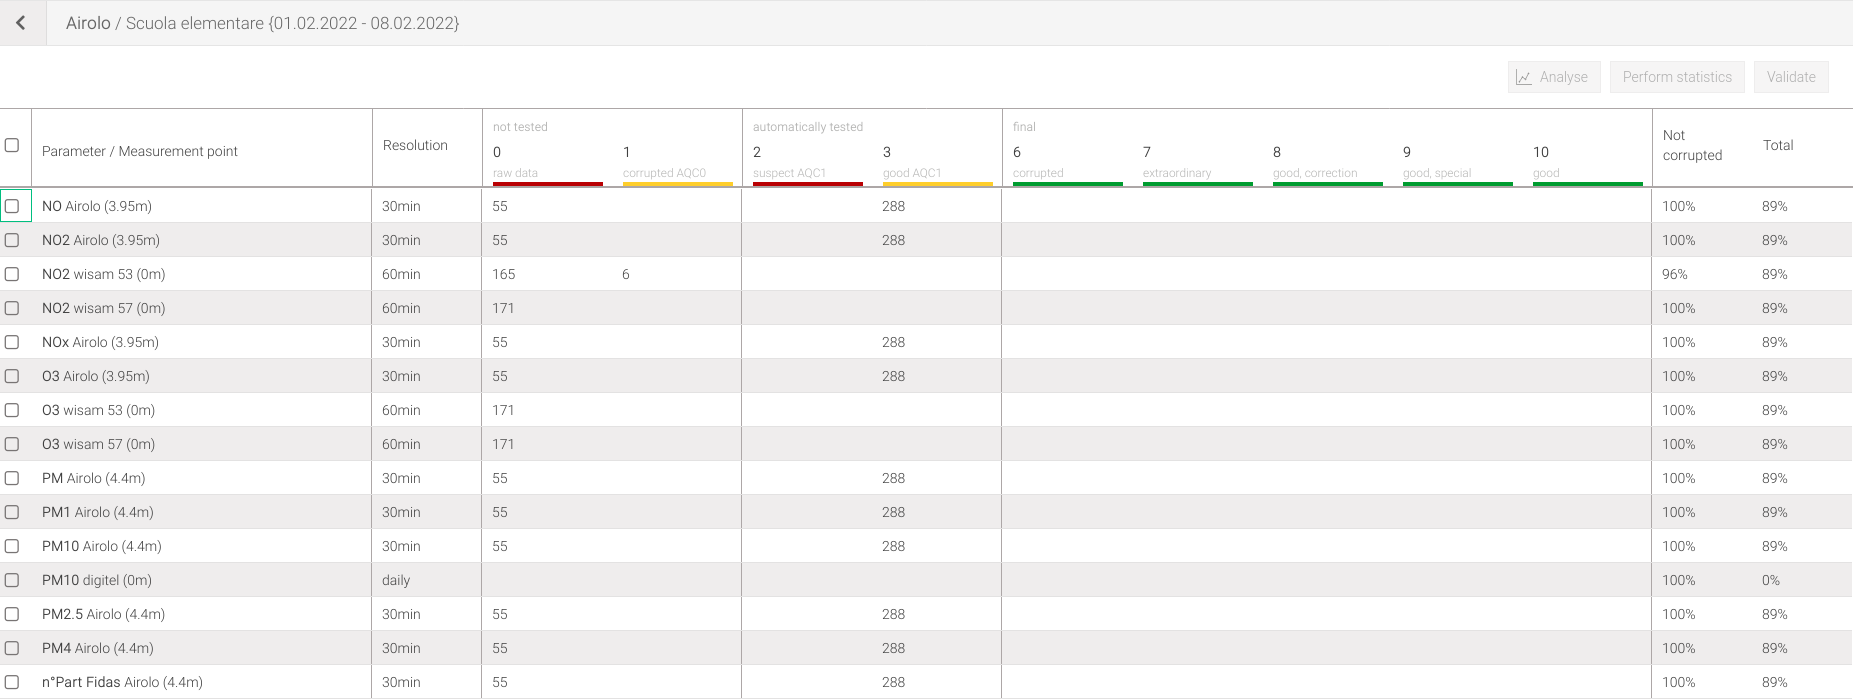
Fig. 308 Validation window by location/parameter
The data can be validated for one or more locations (Fig. 305) or for one or more parameters/measurement points (Fig. 308). To do this, select from the list the entry desired to validate and click on the Validate button. This process will change the status of the measurements bringing those from corrupt AQC1 (1) to corrupt HQC (6) and those good ACQ1 (3) to good HQC (10), while all other statuses will not be changed.
To move the state of a measurement to another type of state (7 to 9) use the procedure via data analysis.
Tip
In both the validation by location list (Fig. 305) and the validation by location/parameter list (Fig. 308), selected rows can be copied.
Perform statistics
For each parameter, statistics such as minimum, maximum and average are automatically created once a day, starting from the raw data.
In some case, after a change in measurements, waiting until the next day to see these statistics is not optimal. Therefore, you can calculate them by clicking on the Perform Statistics button (Fig. 305, Fig. 308). Only the statistics of the locations, if you are in the main view (Fig. 305), or of the parameters, if you are in the detailed view (Fig. 308), selected for the period chosen will be recalculated.
Since the calculation of statistics may take time depending on the selection, a warning (Fig. 309) will be displayed if you want to perform this operation or not.
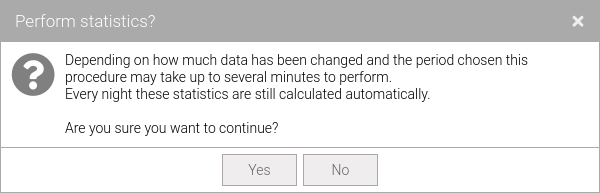
Fig. 309 Perform statistics choice message
Print
To print the validation tables (Fig. 305 and Fig. 308) by clicking on the button in the header bar. From the Print Options window (Fig. 310) it’s possible to choose whether to print as CSV or as an PNG image by changing the Type.
To download the desired print, click on the Print button.
Fig. 310 Print validations list