Metadata
To optimally manage the data collected, it’s also necessary to store information (metadata) that describe where, how and when a data was measured. These are used in the measurement network.
Other types of metadata also allow for aggregations, publications, etc.
Measurement network
The measurement network is the set of metadata that allows describing where, how and when a data item was measured. In order to be able to store this information, it was necessary to study a model that would allow the insertion of this metadata, arriving at the solution described in Fig. 226.
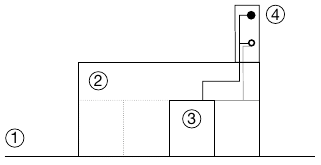
Fig. 226 Scheme of the measurement network
At a location ① there may be one or more measurement systems ② where there are one or more devices ③ that can measure one or more parameters at one or more measurement points ④. With this scheme, the history of each measurement system, device and measurement point is also managed, this means that each of them has a time location (start and end dates of activities).
To access this tool click on the icon and then in the side menu.
This tool represents the scheme of the measurement network. The screen is divided into three columns where for each column the locations, measurement systems, devices and measurement points are represented. In the title of each column, in parentheses, the number of rows in the list below is represented, which changes depending on the active filters.
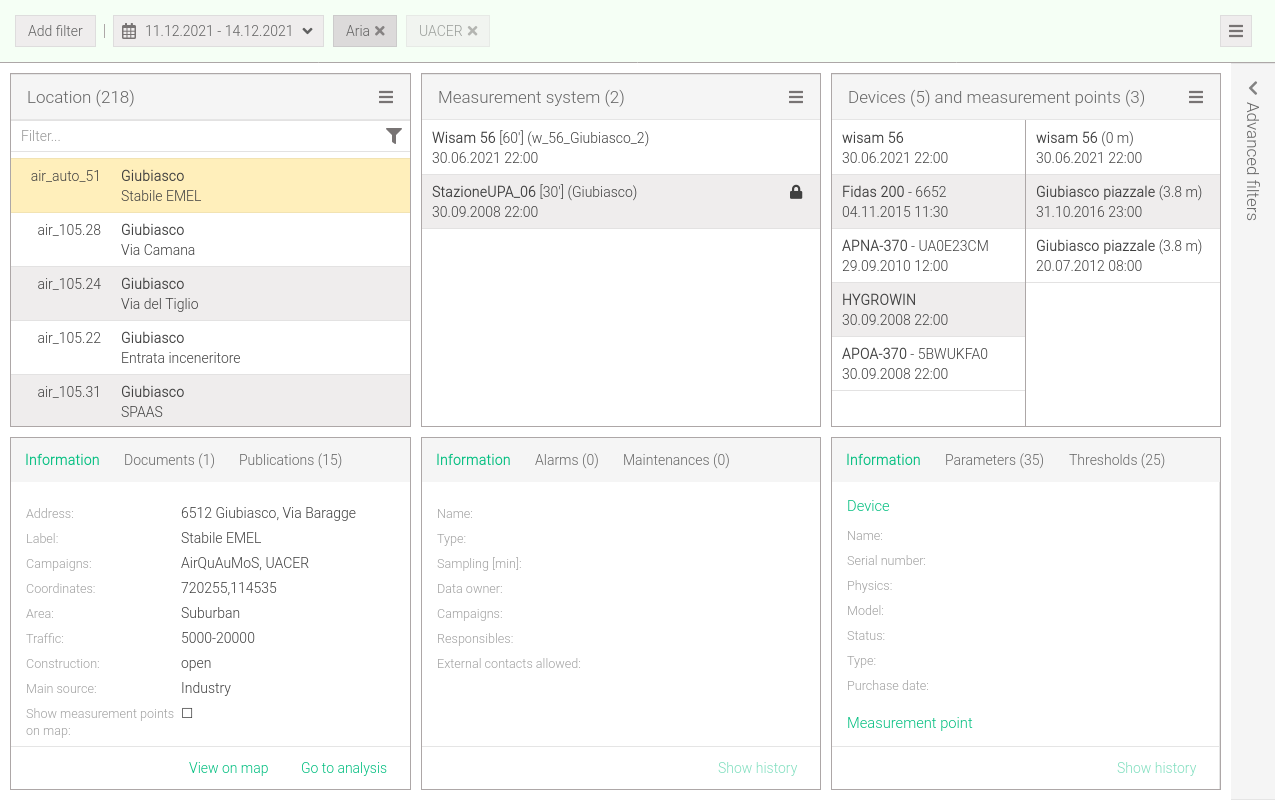
Fig. 227 Measurement network
Location view
In the location list (Fig. 228) contains basic information shown on two lines. The first line shows the identification code (if enabled in user settings), the city (in bold) and the street (if set), while the second line shows the custom label (if set). If a location is configured with measurement systems that are no longer in use it will be displayed in a faded manner.
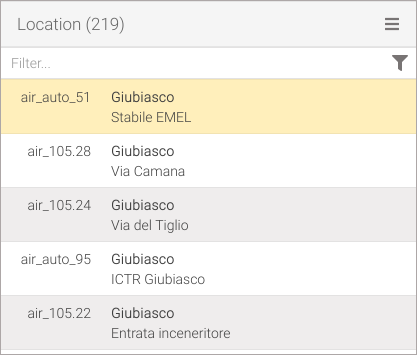
Fig. 228 Measurement network: location list
Tip
If the identification code is not fully visible, placing the mouse over on the text for a few moments to make a tip appear with the code displayed in full.
By selecting a location in the box at the bottom, you will be able to view:
more detailed Information (Fig. 229),
the Attributes list (Fig. 230),
the Documents list (Fig. 231),
the Publications list (Fig. 233).
Clicking on the View on map link in the information box will show the location of the location on the map, while clicking on the Go to analysis link will bring back to the selection screen with the location pre-selected. The attributes box contains all the properties grouped that belong to the selected location. The more detailed documents or publications list can be accessed by clicking on the Go to documents or Go to publications link located at the bottom of the documents or publications box. By double-clicking on a document or clicking on the button, the document preview can be accessed (figure-location-documets-2). Supported formats for previews are .png, .jpg, .pdf, .doc(x) and .xls(x).

Fig. 229 Location information |
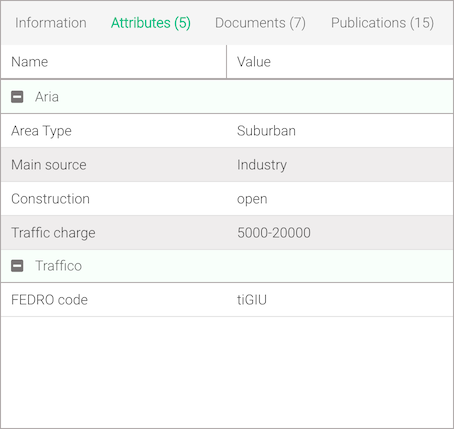
Fig. 230 Location attributes |

Fig. 231 Location documents |
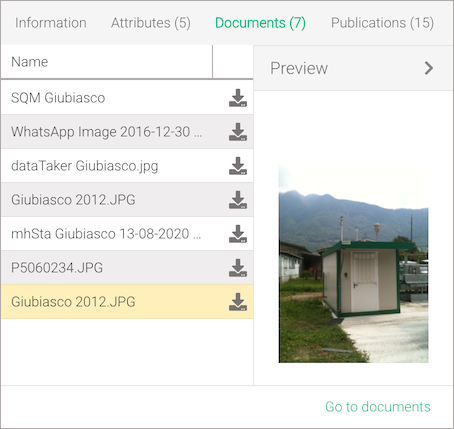
Fig. 232 Location document preview |

Fig. 233 Location publications |
Tip
In all lists, selected rows can be copied.
Measurement system view
In the Measurement system list (Fig. 234) the information available on the first line are the identification code (if enabled in the user settings), the name of the measurement system (in bold) followed by the label used for the import data (round brackets) and the sampling time expressed in minutes (square brackets). On the second line there are the activity start and end date (if the system is off) of the measurement system, if this is off it will be displayed faded.
The icon appears when a measurement system is marked that it contains sensitive data, and will not be able to be viewed by external users (not within the Amministrazione Cantonale) unless explicitly enabled by the responsible. The Informazioni box in the lower part will list the users granted access.
The measurement systems listed are relative to the selected location.
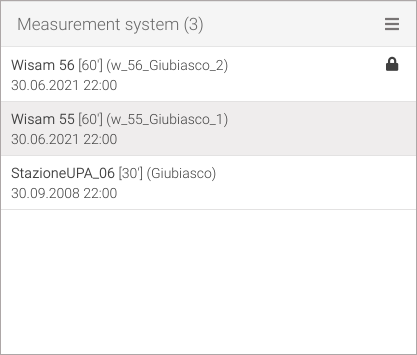
Fig. 234 Measurement network: measurement systems list
Selecting a measurement system in the box at the bottom can be viewed:
more detailed Information (Fig. 235),
the Allarms list (Fig. 236),
the Maintenances list (Fig. 236),
Click on the Show History link in the information box to view the history of the measurement system. The more detailed alarms or maintenances list can be accessed by clicking on the Go to alarms or Go to maintenances link located at the bottom of the alarms respectively maintenances box.
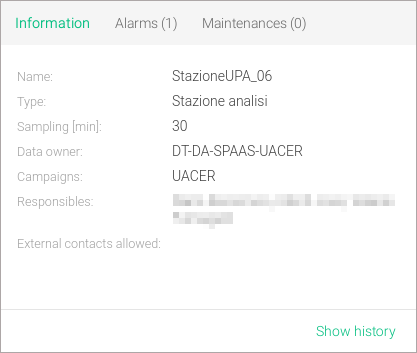
Fig. 235 Measurement system information |
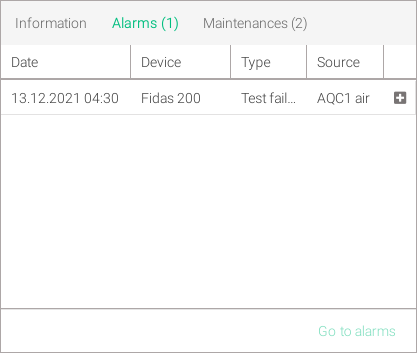
Fig. 236 Measurement system(s) alarms |
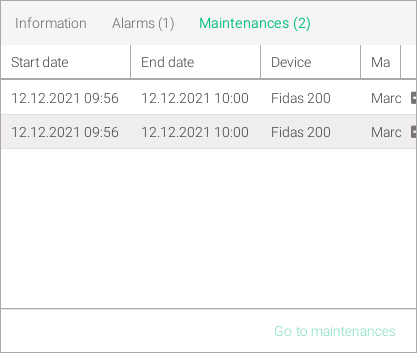
Fig. 237 Measurement system(s) maintenances
Tip
In all lists, selected rows can be copied.
Device/measurement point view
The last column (Devices and Measurement Points) groups both devices and measurement points (Fig. 238). In both the device and measurement point list, the information available on the first line is the identification code (if enabled in user settings) and the name of the device or measurement point (in bold). In the case of the device, the serial number is also displayed (to the left of the name) if configured. On the second line there are the activity start and end date (if the device or measurement point is off), if it’s off it will be displayed faded. The devices listed are relative to the selected location and measurement system (optional), and the measurement points are relative to the selected location, measurement system (optional) and device (optional).
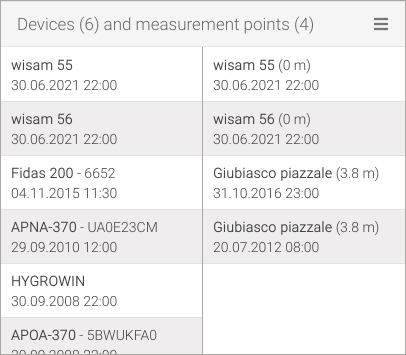
Fig. 238 Measurement network: devices/measurement points list
Selecting a device or measurement point in the box at the bottom will display:
more detailed Information for both the device and the measuring point (Fig. 239),
the Parameters (Fig. 240),
the Thresholds list (Fig. 241).
Click on the Show History link in the information box to view the history of the device. The more detailed parameters or thresholds list can be accessed by clicking on the Go to Parameters or Go to Thresholds link located at the bottom of the parameters or thresholds box.
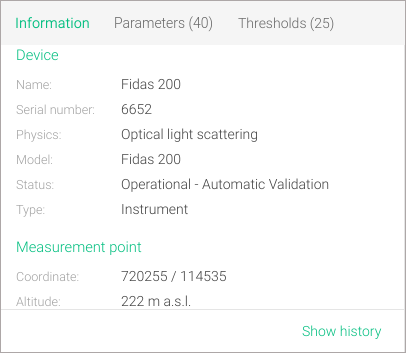
Fig. 239 Device/measurement point information |
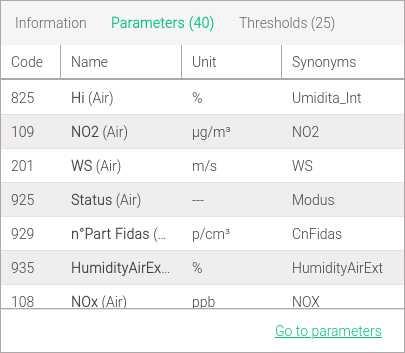
Fig. 240 Device(s) parameters |
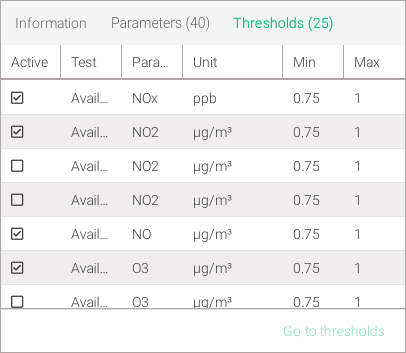
Fig. 241 Device(s) thresholds
Note
All displayed metadata can be filtered using the global filter.
Note
If some data relating to the measurement network are not visible, this is probably due to the filters that have been set, pay particular attention to the selected dates.
Tip
In all lists, selected rows can be copied.
Show measurement point or device history
Measurement systems and devices, in the course of their activity, can be moved to multiple locations this creates a history over time of the moved measurement system/device.
To access this feature, select a measurement system or device and in the information box (Fig. 235, Fig. 239) click on the Show History link, this will open a view similar to the measurement network (Fig. 242, Fig. 243) where only data about the measurement system or device over the time span of all its activity will be displayed.
For example, in Fig. 242 it can be seen that the mobile weather station measurement system has been moved to four locations over time, while in Fig. 243 it can be seen that the APNA-370 device has been moved to two locations.
To close this view click on the button in the upper left corner.
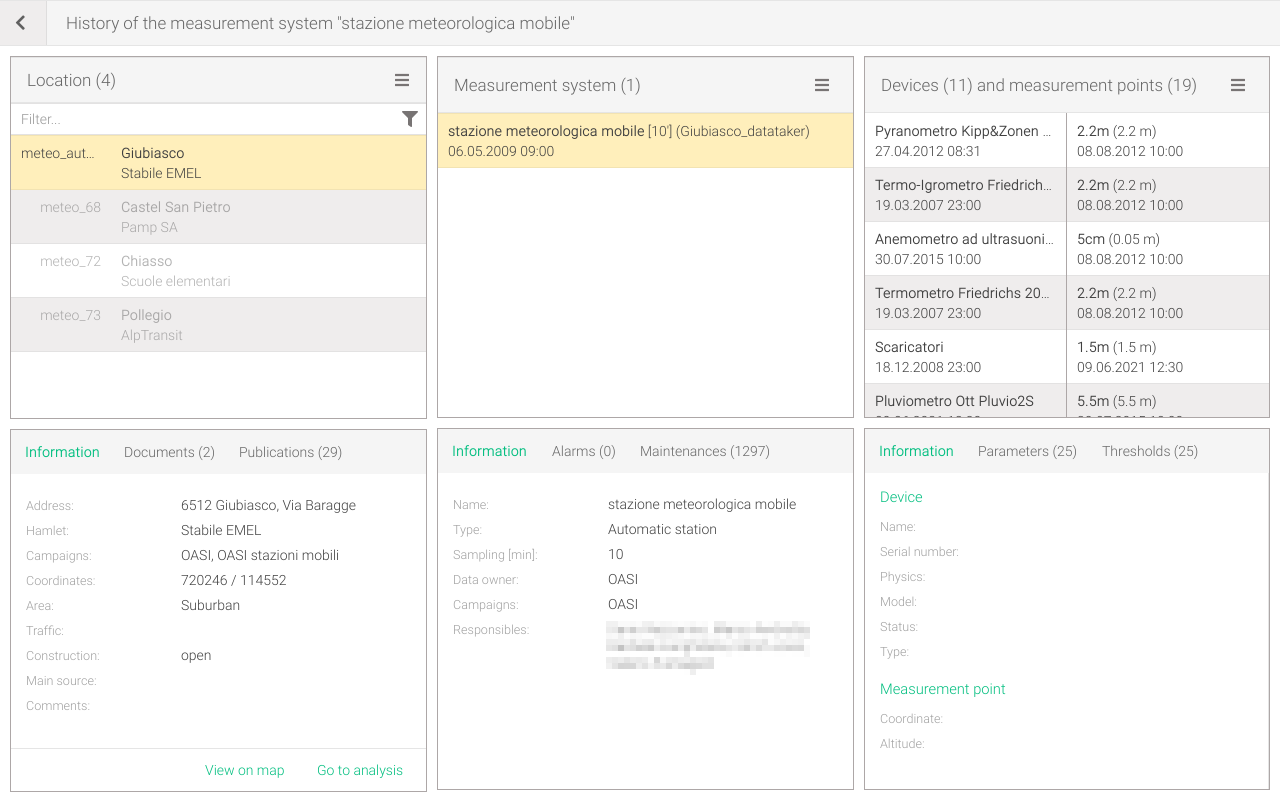
Fig. 242 History of the displacements of a measurement system

Fig. 243 History of the displacements of a device
Advanced filters
Advanced filters can be applied to the metadata of the measurement network. To access this functioin click on the right sidebar Advanced filters of the measurement network screen (Fig. 227).
- It’s possible to filter (as shown in Fig. 244) the measurement network by:
measurement system where the user results As responsible
Measurement system by its Id,
Device by its Id,
Measurement point by its Id,
Parameter by its (if nothing is selected it is as if they are all selected), Id, Name or Grouping type
To find out the identification code (ID) of a measurement system, device, measurement point or parameter, enable the show code option in the user profile preferences .
If any of these filters are active an asterisk character (*) will be displayed in the panel title. To reset all filters to zero click the Reset button.
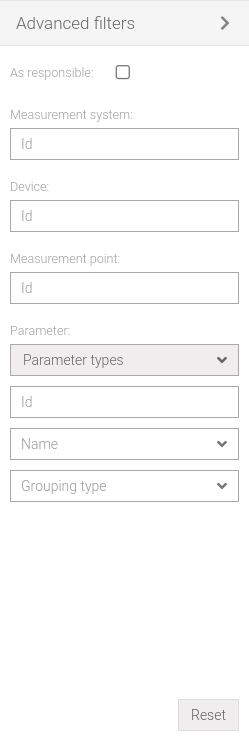
Fig. 244 Measurement network: advanced filters
Add items
Metadata can be added via a step-by-step wizard:
- Step 2: add a measurment system (Fig. 247)
Step 2.1 (optional): link one or more campaigns to the measurement system (Fig. 248). To add a new campaign see the related section.
Step 2.2 (optional): link one or more responsibles to the measurement system (Fig. 249). To add a new responsible, see the related section.
- Step 3: add a device (Fig. 250)
- Step 3.1: link one or more parameters to the device (Fig. 251). To add a new parameter, see the related section.
Step 3.1.1 (optional): add one or more synonyms to the device parameters (Fig. 252). Synonyms are used for data import.
Step 4: add a new measurment point (Fig. 253) or link an existing one (Fig. 254)
Step 5 (optional): add one or more thresholds (Fig. 255 and Fig. 256)
It’s not mandatory to start with the first step but it’s possible to access any of them in the following way:
in step 1 by clicking on the button from the Location box and then on the menu item
in step 2 by selecting a location, clicking on the button from the Measurement systems box and then on the menu item
in step 3 by selecting both a location and a measurement system, clicking on the button from the Devices and Measurement points box and then on the menu item
in step 4 by selecting a location, a measurement system, and a device, clicking on the button from the Devices and Measurement points box and then on the menu item
in step 5 by selecting a measurement point, clicking on the button from the Devices and Measurement points box and then on the menu item
Regardless of where the wizard starts, it’s mandatory to advance until a measuremt point is added in order to save the changes.
Warning
If one start the wizard from Step 3 or later it’s mandatory to be responsible for the measurement system.
Note
The user who inserts a new measurement system is automatically added as responsible even if not specified during the wizard.
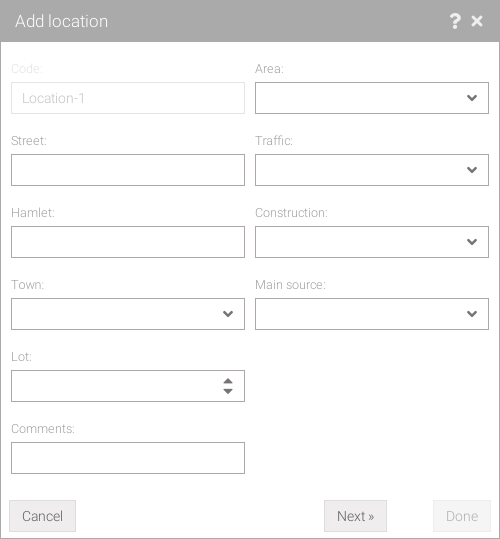
Fig. 245 Wizard: add location
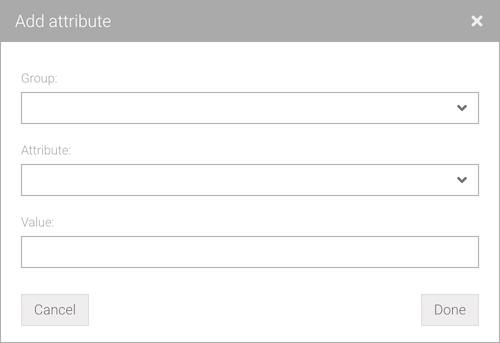
Fig. 246 Wizard: add attribute to location
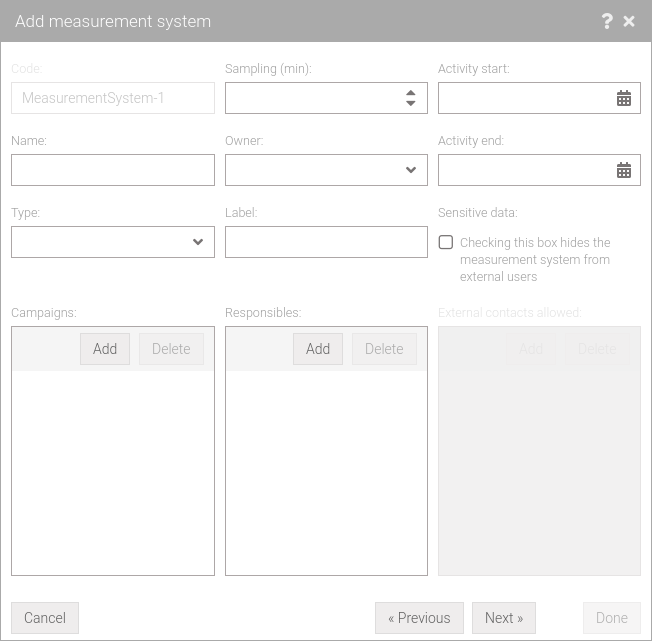
Fig. 247 Wizard: add mesurement system
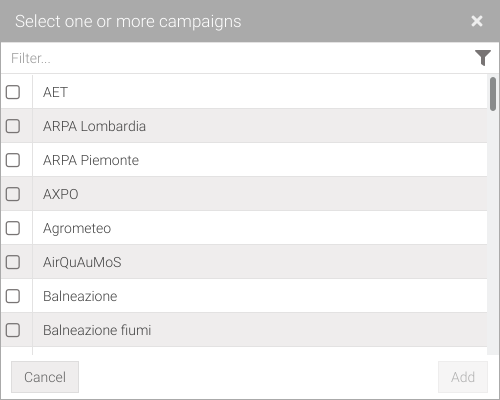
Fig. 248 Wizard: link campaign(s) to measurement system |
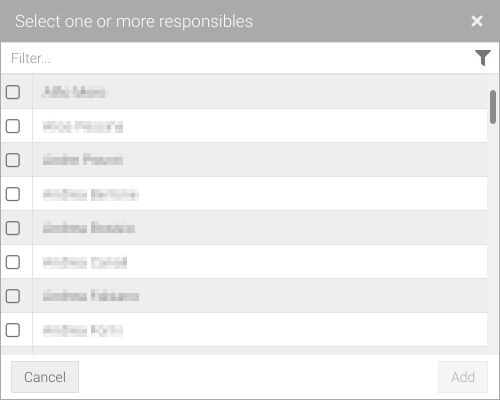
Fig. 249 Wizard: link responsible(s) to measurement system |
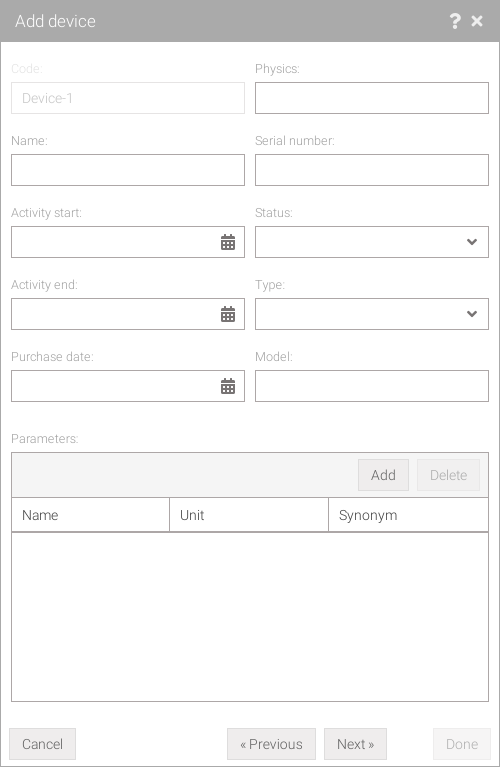
Fig. 250 Wizard: add device
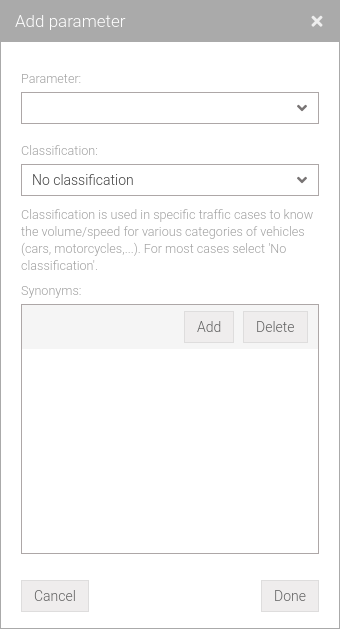
Fig. 251 Wizard: link parameter(s) to device |
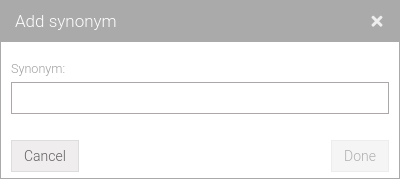
Fig. 252 Wizard: add a synonym |
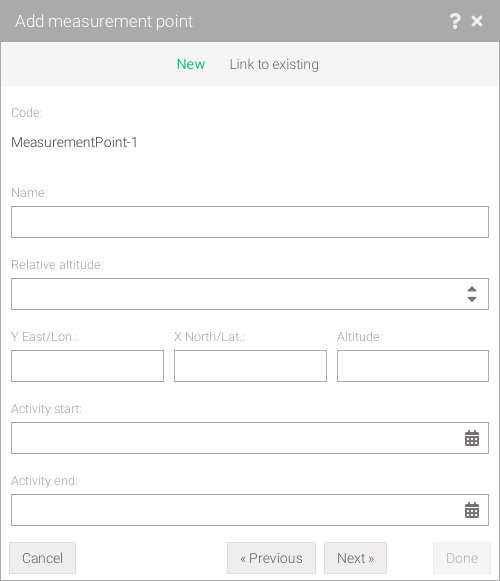
Fig. 253 Wizard: add measurement point |
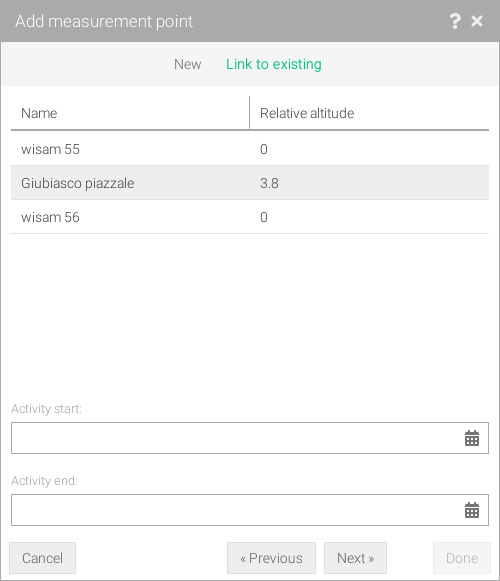
Fig. 254 Wizard: link to an existings measurement point |
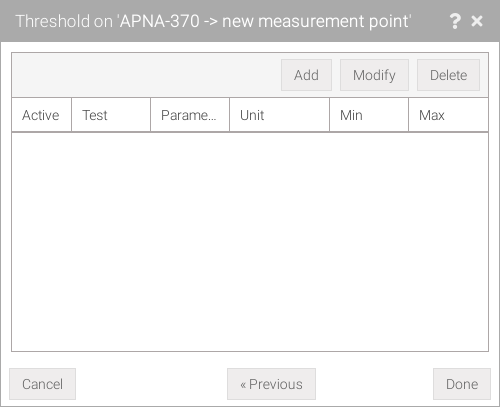
Fig. 255 Wizard: threshold |
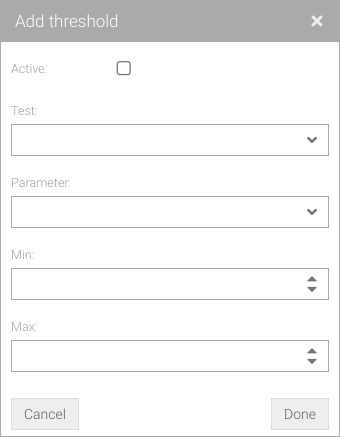
Fig. 256 Wizard: add threshold(s) |
Modify items
To modify select the desired metadata in the lists, click on the button choosing one of the desired fields. This will open one of the windows for adding (Fig. 245-Fig. 256) but with the fields already filled for the selected element. Click Done to save the changes.
Warning
To be able to change any item the user must be listed as responsible in the measurement system to which it’s connected.
Note
Disabled fields (shown in a slightly lighter color) cannot be edited.
Remove items
Currently it’s not possible to remove any metadata related to the measurement network, this is intended to prevent important information from being deleted by the user. If you need to remove something contact the oasi team via the Send feedback form indicating as the Area of Interest.
Dismiss a measurement system or device
It’s possible to dismiss a measurement system or device which means adding an end of activity date. Unlike modify an item, where it’s possible to change the activity end date, this procedure will also change the measurement points related to the measurement system or device that are still active while those that are already dismissed will not be touched by the procedure. In case a measurement system is dismissed, the measurement point table will also report the associated device since multiple devices can measure at the same point.
To access this feature select the desired measurement system or device to dismiss and click on the button from the Measurement systems or Devices and Measurement points box (Fig. 227) and then choose the menu item. A window will open (Fig. 257, Fig. 259) where to insert an Activity end date for the measurement system or device, automatically the measurement points affected and showed in the Measurement points table will be marked with a red triangle.
Click Done to accept the changes.
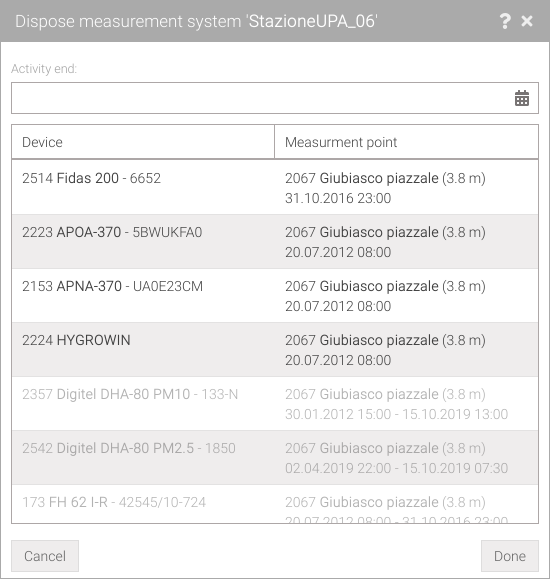
Fig. 257 Dismiss measurement system |
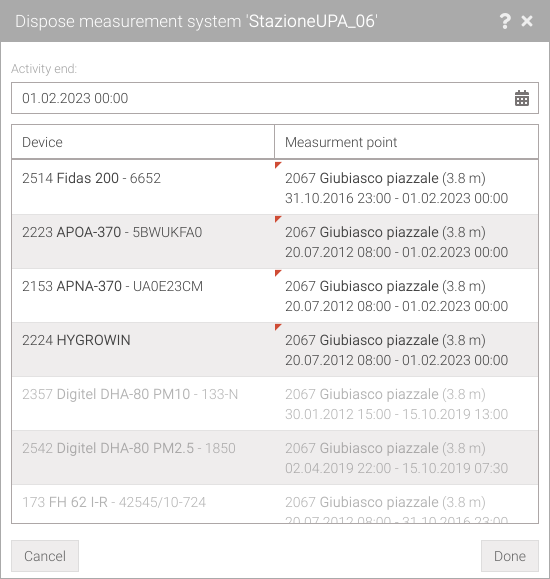
Fig. 258 Dismiss measurement system: modify |
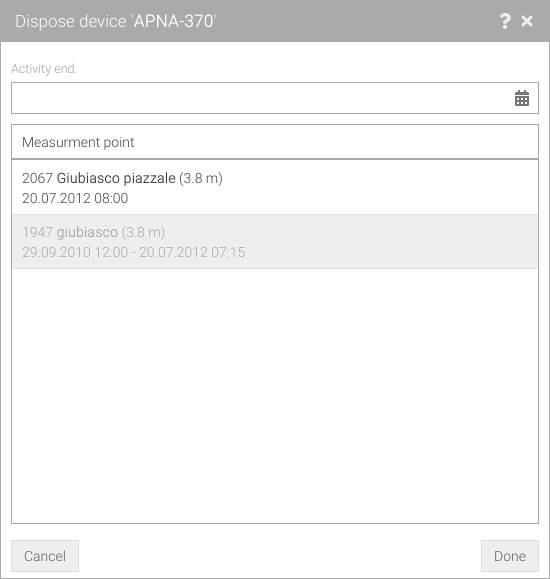
Fig. 259 Dismiss device |
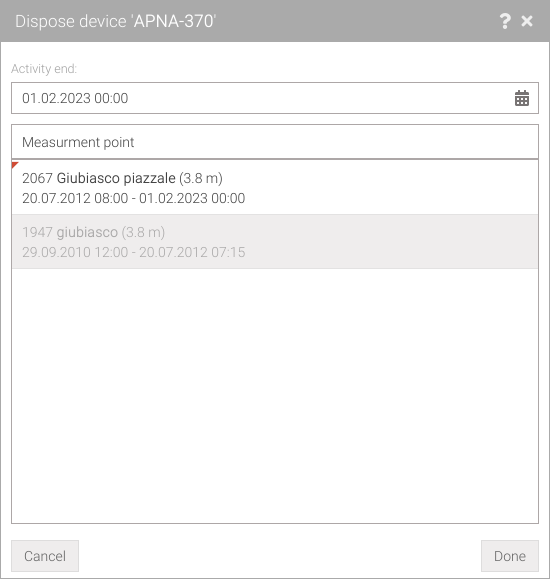
Fig. 260 Dismiss device: modify |
Warning
Once a measurement system or device is dismissed is no more chance to change the activity end date a second time (for example, due to an error) with this tool. However, it is still possible to change dates manually by modify items manually.
Move a measurement system
It’s possible to move a measurement system to a different location, this implies that the devices connected to it can also be moved while the measurement points will have to be associated with existing ones in the new location or new ones created.
To access this feature select the measurement system to be moved and click on the button from the Location box (Fig. 227) and then choose the menu item. A window will open (Fig. 261) where it’s possible to fill the Activity end date for the measurement system at the current location, then choose the new location, from the Select or create new Location drop-down menu, and finally fill the new Activity start date.
It’s also possible to create a new location by clicking on the + button. This will open the wizard window that allows to fill the data for the new location (Fig. 245). Clicking on the Done button in the move window will appear the name of the newly created location (Fig. 262). Clicking on the - button will remove the created location, returning to the option of choosing an existing one.
By clicking on the Next » button, the window will appear which allows to associate the devices with measurement points (Fig. 263) existing in the new location or to create a new measurement point by clicking on the Add new measurement point button. To associate a measurement point, click on the drop-down menu in the New measurement point column which will list the possible measurement points (of the locations or the new ones).
To ignore moving instrument, leave the New measurement point column blank.
Click Done to accept the changes.
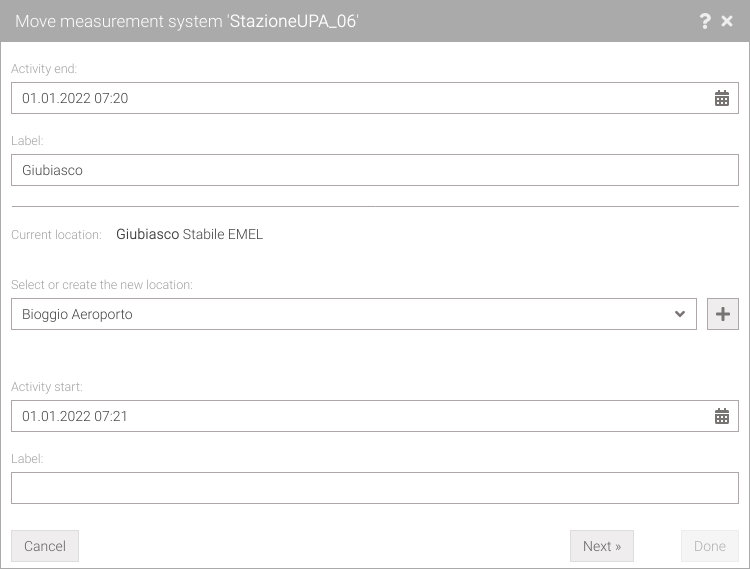
Fig. 261 Move measurement system |
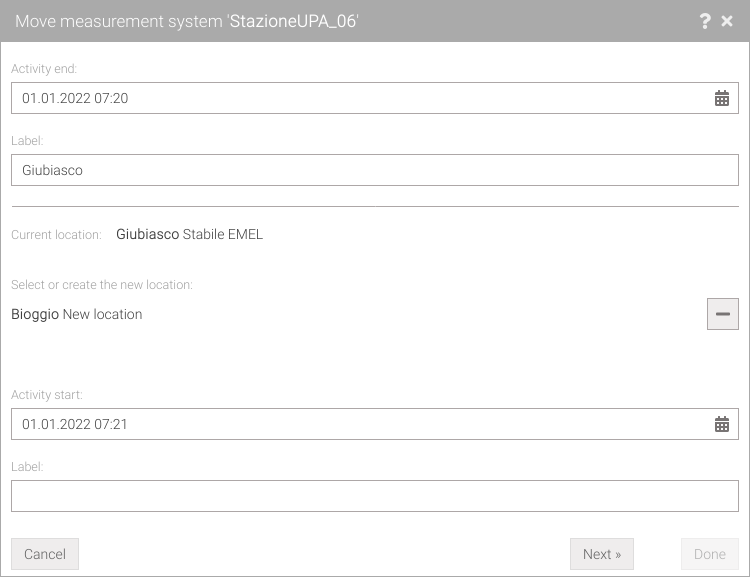
Fig. 262 Move measurement system creating a new location |

Fig. 263 Associate devices and measurement points
Warning
It’s not possible to move a measurement system with all devices deactivated, to complete the procedure first reactivate at least one device.
Move a device
It’s possible to move a device to a different measurement system. The measurement points will have to be associated with the existing ones in the new measurment system or or new ones created.
To access this feature select the device to be moved and click on the button from the Devices and measurement points box (Fig. 227) and then choose the menu item. A window will open (Fig. 264) where it’s possible to fill the Activity end date for the device at the current measurement system, then choose the new measurement system, from the Select new measurement system drop-down menu, and finally fill the new Activity start date.
It’s also possible to create a new location and a new measurement system by clicking on the + button. This will open the wizard window that allows to enter the data for the new location (Fig. 245) and the new measurement system (Fig. 247). If an existing location was chosen from the drop-down menu, the widzard window will only propose the creation of a new measurement system. By clicking on the Done button in the move window will appear the name of the newly created location and/or new measurement system (Fig. 265, Fig. 266). Clicking the - button will remove the created location and/or measurement system and return to the option of choosing existing ones.
By clicking on the Next » button, the window will appear which allows to associate the devices with measurement points (Fig. 263) existing in the new measurement system or to create a new measurement point by clicking on the Add new measurement point button. To associate a measurement point, click on the drop-down menu in the New measurement point column which will list the possible measurement points (of the measurement system or the new ones).
Click Done to accept the changes.
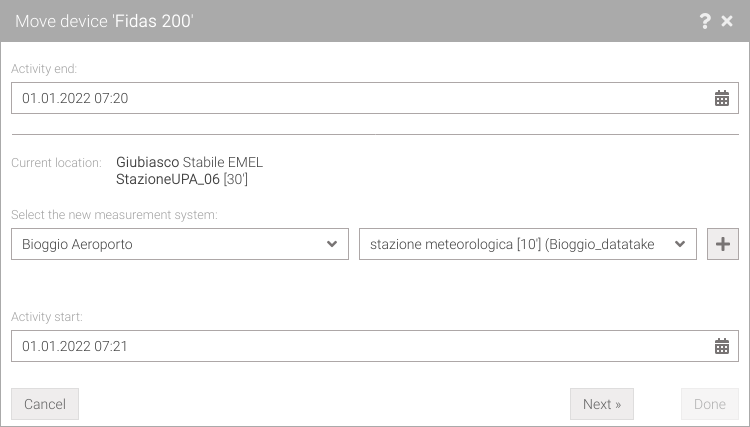
Fig. 264 Move device |
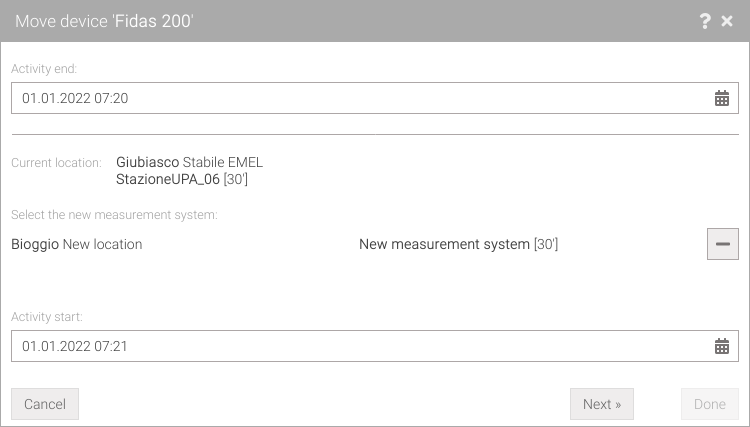
Fig. 265 Move device creating a new location and measurement system |
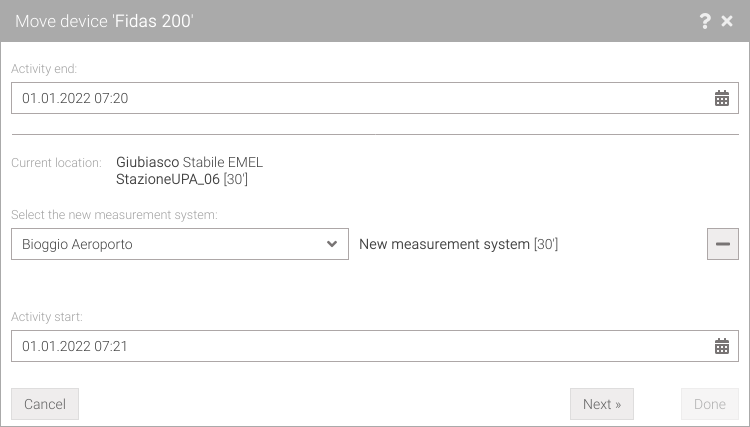
Fig. 266 Move device creating a new measurement system |
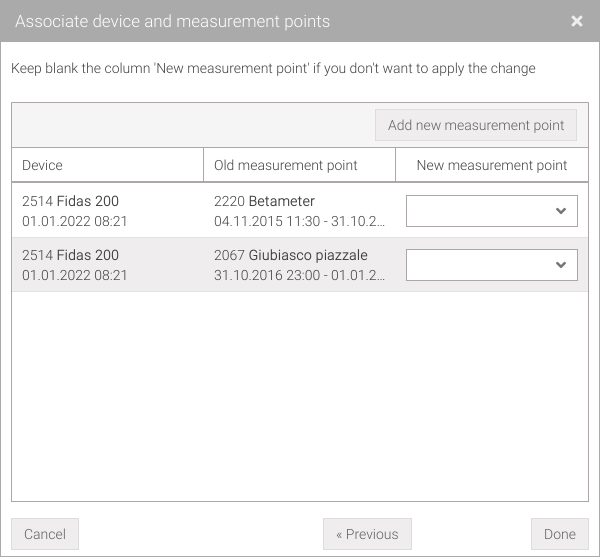
Fig. 267 Associate devices and measurement points |
Campaigns
Campaigns are used as grouping metadata and can be used in the measurement network when adding or modifying measurement systems.
To access this tool, click on the icon and then in the side menu.
In this view (Fig. 268) all the available campaigns will be listed.
The campaigns can be filtered with the Campaign filter text field located at the top left. The filter will look for a match either in the name or in the description.
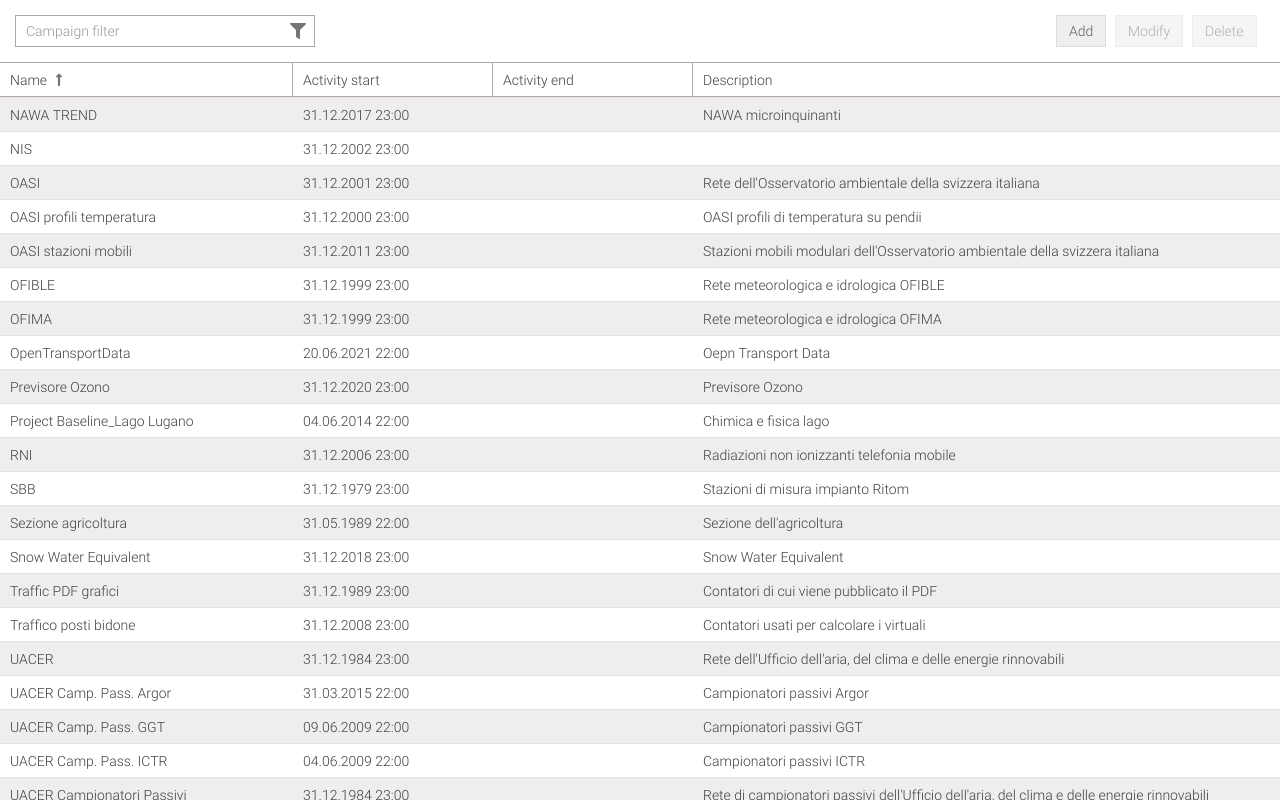
Fig. 268 Available campaigns list
Tip
In the campaign list, selected rows can be copied.
Add
To add a new campaign click on the Add button where a window will open which allows to create it (Fig. 269). Click Done to add the campaign.
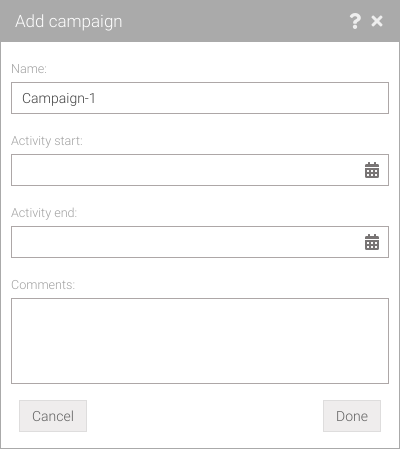
Fig. 269 Add campaign window
Note
Mandatory or incorrectly filled fields will be marked with red borders. Moving the mouse over the relevant field will give an explanation.
Modify
To modify select the desired campaign from the list (Fig. 268) and click on the Modify button. This will open the same window for adding (Fig. 270) but with already filled fields for the selected campaign. Click Done to apply the changes.
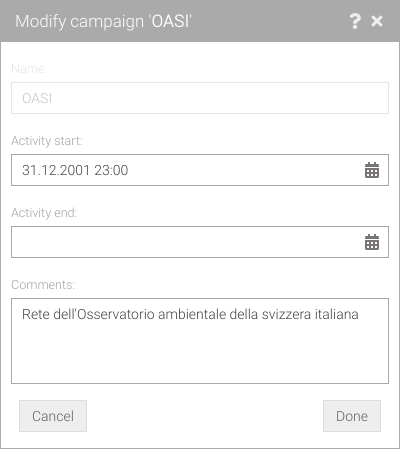
Fig. 270 Modify campaign window
Note
Disabled fields (shown in a slightly lighter color) cannot be edited.
Remove
To remove select the desired campaign from the list (Fig. 268) and click on the Delete button. Confirmation will be asked if really want to remove the selected campaign.
Warning
If the campaign is used in some measurement system, it will not be deleted.
Print
It’s possible to print the alarms (Fig. 268) by clicking on the button in the header bar which will export the displayed table in .csv format.
The applied filters will also kept in the exported file while the sorting will not.
Parameters
The Parameter determines what a measurement represents, detected with a device, and is associated with a specific measurement unit.
To access this tool, click on the icon and then in the side menu.
In this view (Fig. 271) all the available parameters will be listed.
The parameters can be filtered by name, description or measure unit using Filter, by domain via the All domains drop-down menu or by parameter type via the drop-down menu (if nothing is selected it is as if they are all selected). All filters can be found in the upper left.
It’s possible to display the parameter list in a compact form (Fig. 272) by disabling the Expand rows checkbox.
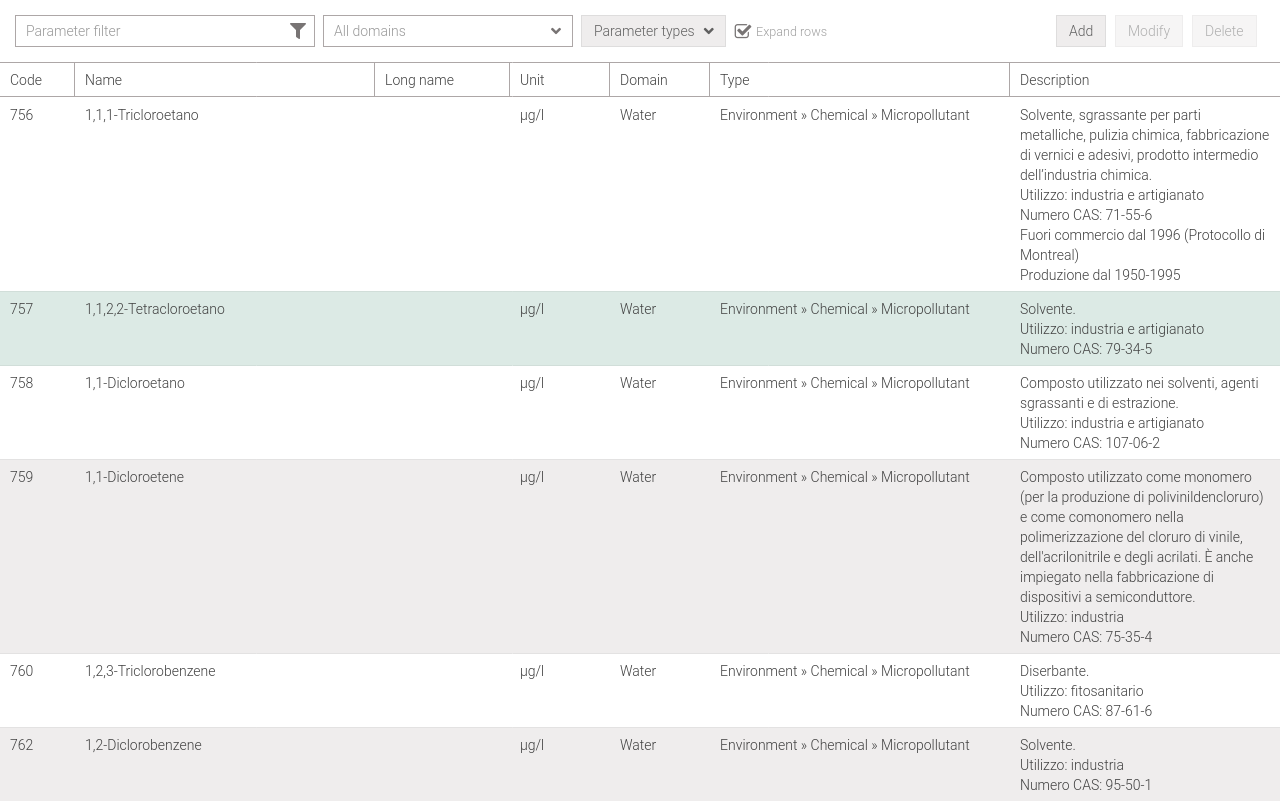
Fig. 271 Available parameters list
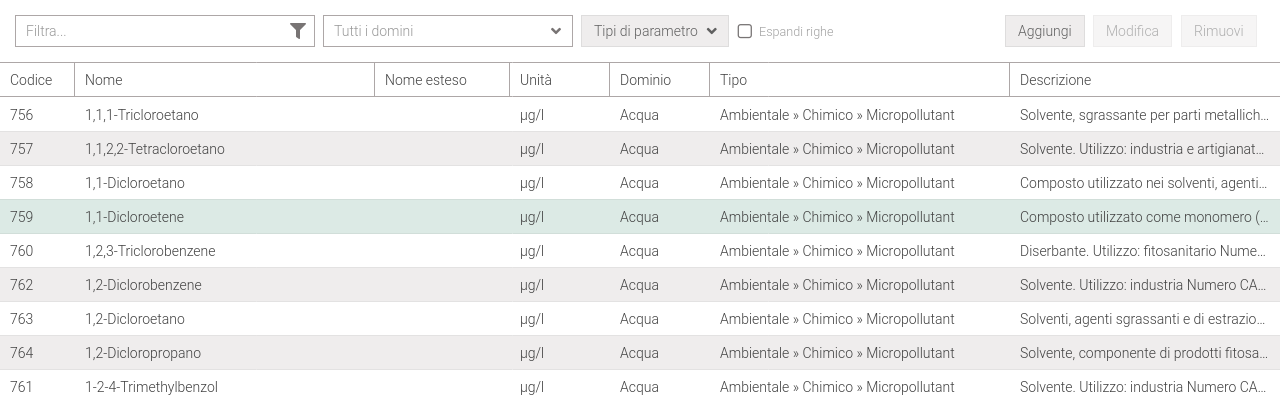
Fig. 272 Parameters list in copact form
Tip
In the parameter list, selected rows can be copied.
Add
To add a new parameter click on the Add button located in the upper right corner of the window. Adding is done in two steps via wizard:
Step 1: fill parameter data (Fig. 273),
Step 2: add the physical thresholds (Fig. 274), which are the device’s limit thresholds that if they are exceeded an error will be reported via email.
Click Done button to add the campaign.
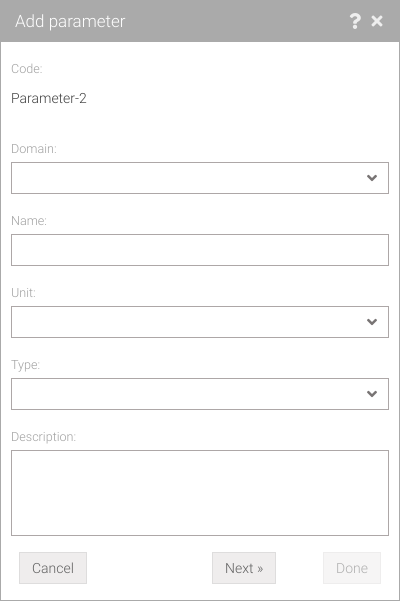
Fig. 273 Wizard: add new parameter |
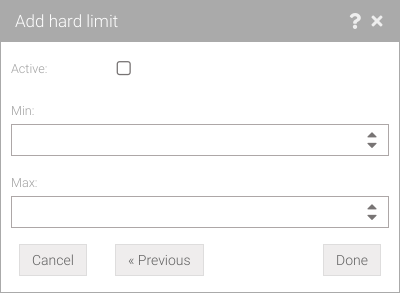
Fig. 274 Wizard: add physical thresholds |
Note
Mandatory or incorrectly filled fields will be marked with red borders. Moving the mouse over the relevant field will give an explanation.
Modify
To modify select the desired parameter from the list (Fig. 271) and click on the Modify button. This will open the same wizard for adding (Fig. 273) but with already filled fields for the selected parameter. Click Done to apply the changes.
Note
Disabled fields (shown in a slightly lighter color) cannot be edited.
Remove
To remove select the desired parameter from the list (Fig. 271) and click on the Delete button. Confirmation will be asked if really want to remove the selected campaign.
Warning
If the parameter is in use in some device this will not be deleted.
Print
It’s possible to print the parameters (Fig. 271) by clicking on the button in the header bar which will export the displayed table in .csv format.
The applied filters will also kept in the exported file while the sorting will not.
Measure unit
A measure unit is a predetermined quantity of a physical quantity, defined by parameter, that is used as a shared reference for measuring that quantity.
To access this tool, click on the icon and then in the side menu.
In this view (Fig. 275) all the measure units will be listed.
The measure units can be filtered with the Measure unit filter text field located at the top left. The filter will look for a match found in the name, the description or synonyms.
It’s possible to display the measure unit list in a compact form (Fig. 276) by disabling the Expand rows check

Fig. 275 Available measure units list
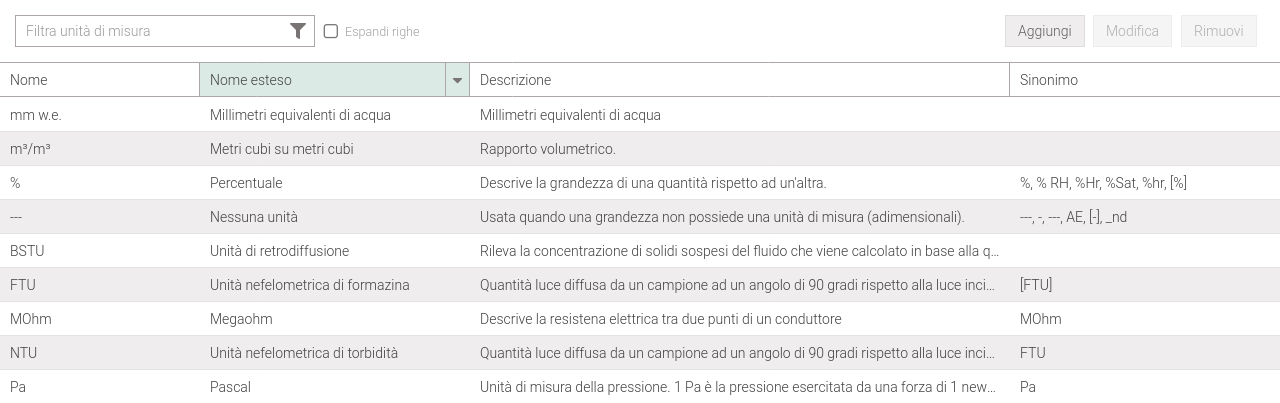
Fig. 276 Measure units list in compact form
Note
Synonyms are used at automatic data import in case the name of the measure unit specified in the imported file differs with the one used in Palma.
Tip
In the measure unit list, selected rows can be copied.
Add
To add a new measure unit click on the Add button (Fig. 275) where a window will open which allows to create it (Fig. 277). Click Done to add the measure unit created.
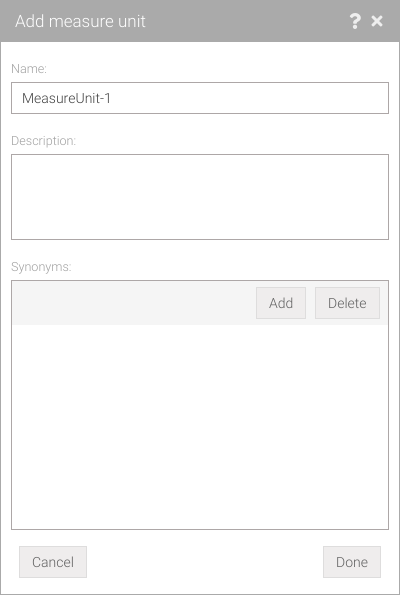
Fig. 277 Add measure unit window
Note
Mandatory or incorrectly filled fields will be marked with red borders. Moving the mouse over the relevant field will give an explanation.
Modify
To modify select the desired measure unit from the list (Fig. 275) and click on the Modify button. This will open the same window for adding (Fig. 278) but with already filled fields for the selected measure unit. Click Done to apply the changes.
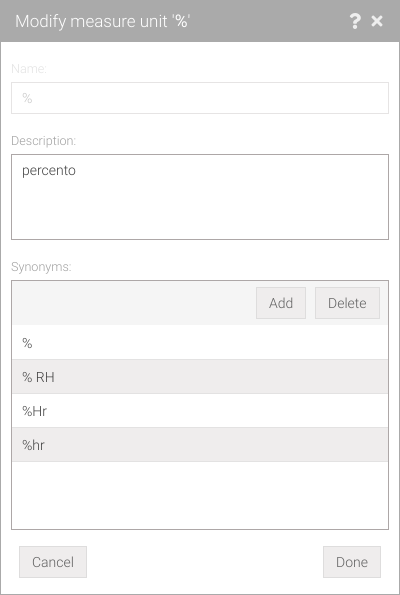
Fig. 278 Modify measure unit window
Note
Disabled fields (shown in a slightly lighter color) cannot be edited.
Remove
To remove select the desired measure unit from the list (Fig. 275) and click on the Delete button. Confirmation will be asked if really want to remove the selected measure unit.
Warning
If the measure unit is used in some parameter, it will not be deleted.
Print
It’s possible to print the alarms (Fig. 275) by clicking on the button in the header bar which will export the displayed table in .csv format.
The applied filters will also kept in the exported file while the sorting will not.
Conversion factors
Conversion factors are used at automatic data import if the measure unit, of a given parameter, specified in the imported file differs from that used in Palma (e.g., g to mg).
To access this tool, click on the icon and then in the side menu.
In this view (Fig. 279) all the conversion factors will be listed.
Using the Parameter/unit filter filter field, for filter conversion factors by parameter name or by measure unit. It’s also possible to filter by domain via the All domains drop-down menu.
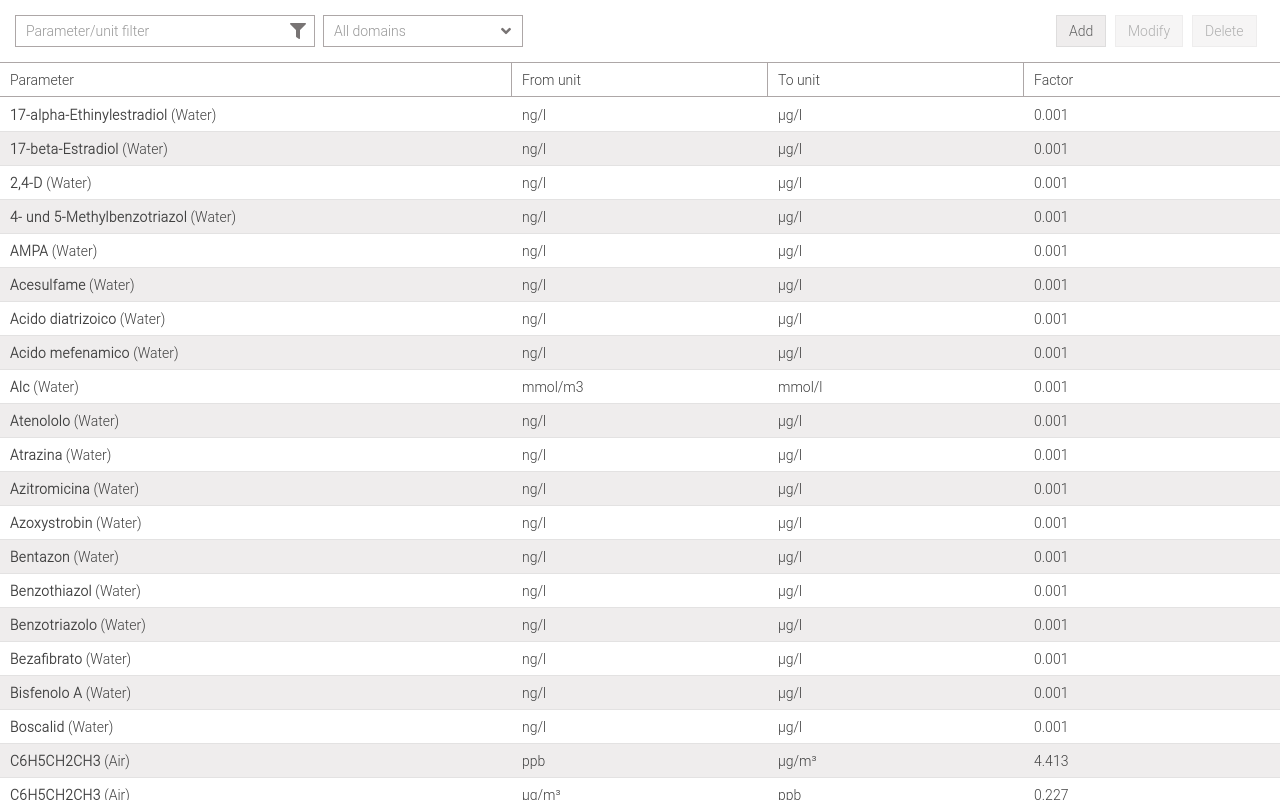
Fig. 279 Conversion factors list
Tip
In the conversion factor list, selected rows can be copied.
Add
To add a new conversion factot click on the Add button (Fig. 279) where a window will open which allows to create it (Fig. 280). Click Done to add the conversion factor created.

Fig. 280 Add conversion factor window
Note
Mandatory or incorrectly filled fields will be marked with red borders. Moving the mouse over the relevant field will give an explanation.
Modify
To modify select the desired conversion factor from the list (Fig. 279) and click on the Modify button. This will open the same window for adding (Fig. 281) but with already filled fields for the selected conversion factor. Click Done to apply the changes.
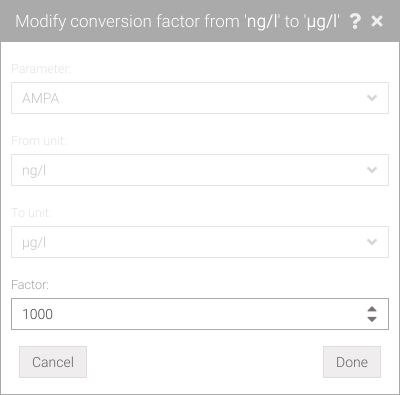
Fig. 281 Modify conversion factor window
Note
Disabled fields (shown in a slightly lighter color) cannot be edited.
Remove
To remove select the desired conversion factor from the list (Fig. 279) and click on the Delete button. Confirmation will be asked if really want to remove the selected conversion factor.
Warning
Conversion factors are used at automatic data import, deleting one of these could block the import of that data.
Print
It’s possible to print the conversion factors (Fig. 279) by clicking on the button in the header bar which will export the displayed table in .csv format.
The applied filters will also kept in the exported file while the sorting will not.
Publications
Data found in Palma can be published at www.oasi.ti.ch accessible to all without restriction. A publication is linked to a particular location and the parameters it acquires through its measurement systems and devices. There are different types of publications (Table 3) with which a location/parameter can be associated.
To access this tool, click on the icon and then in the side menu.
The view is divided into two columns where in the first there are the list of all locations (even if they do not have active publications), and in the second - if a location is selected - all combinations of measurement points/parameters that are published grouped by publication type.
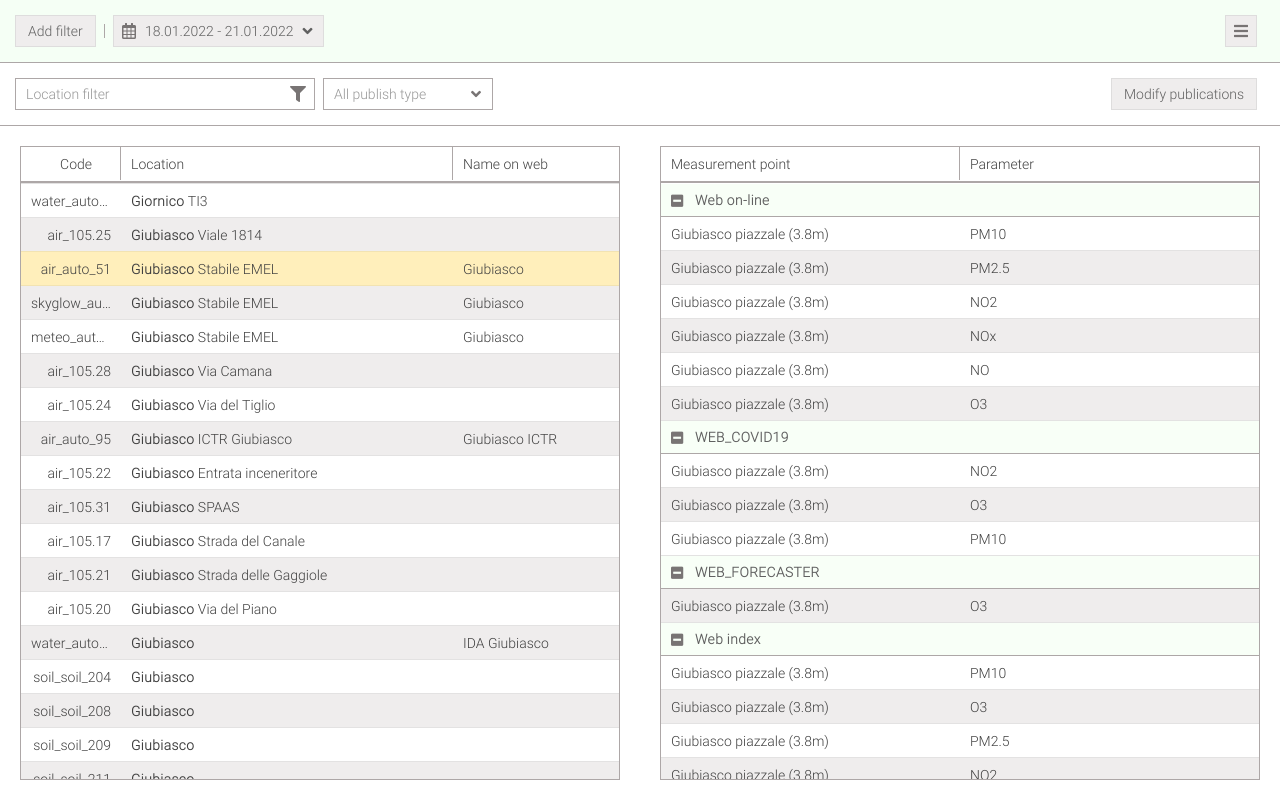
Fig. 282 Publications list
In the locations list there are the basic information, i.e., the identification code (if enabled in user settings), the city (in bold) and the street (if set) followed by a personal label (if set), and the name that will be displayed on the web pages.
In the measurement points/parameters list for each row, the information is the name of the measurement point with its relative height (in parentheses) and the name of the parameter. The codes identified by measurement point and parameter will be displayed if enabled in user settings.
Using the Locations filter field, for filter locations by identification code, city, or personal label. It’s also possible filter by publish type via the All publish types drop-down menu.
Publish type |
Description |
Active |
|---|---|---|
Web on-line |
Publication in web pages of online data (e.g., Aria page) |
yes |
Web index |
Publication of a trend indicator on web pages |
no |
Web surface water |
Publication on the hydrology web pages Rivers, Lakes and Precipitations <https://www.oasi.ti.ch/web/dati/idrologia-precipitazioni.html>`_ |
yes |
Web ground water |
Publication on the hydrology aquifer web page |
yes |
Web soil |
Publication on the soil web page |
yes |
Web soil chemistry |
Publication on the soil chemistry web page |
yes |
Web ICP waters |
Publication on the ICP waters web page |
yes |
Web bathing |
Publication on the bathing web page |
yes |
Web ICTR |
Publication on the ICTR web page |
yes |
Web wastewater treatment |
Publication on the wastewater treatment web page |
yes |
Web surface water (rivers) quality |
Publication on the Surface water quality: rivers web page |
yes |
Web surface water (lakes) quality |
Publication on the Surface water quality: lakes web page |
yes |
Web ground water quality |
Publication on the Groundwater quality web page (not yet published) |
no |
Web glaciers |
Publication on the Glaciers web page |
yes |
Web annual trend |
Publication on the annual trend web pages hydrology, air, weather, noise e traffic |
yes |
Web forecaster |
Publication on the ozone forecaster web page |
yes |
Email PM10 |
Send an email when the OAPC PM10 limit is exceeded |
yes |
Note
All publications listed can be filtered thanks to the global filter.
Warning
Only locations with a name on web and at least one parameter set will be published.
Tip
All the columns of the lists can be sorted by clicking on the column title.
Tip
In the publication list, selected rows can be copied.
Add
To add a location parameter as a new publication, see the Modify section.
Modify
To modify a publication for a location, which means adding and removing parameters, select a location and click on the Modify publications button (Fig. 282) where a window will open that allows editing (Fig. 283). In this window it’s possible to modify the Name on web, which is the name published on the web page, and Publish type that is activated when a Measurement Point and Parameter is choosen (Fig. 284).
Click Done button to add the publication.
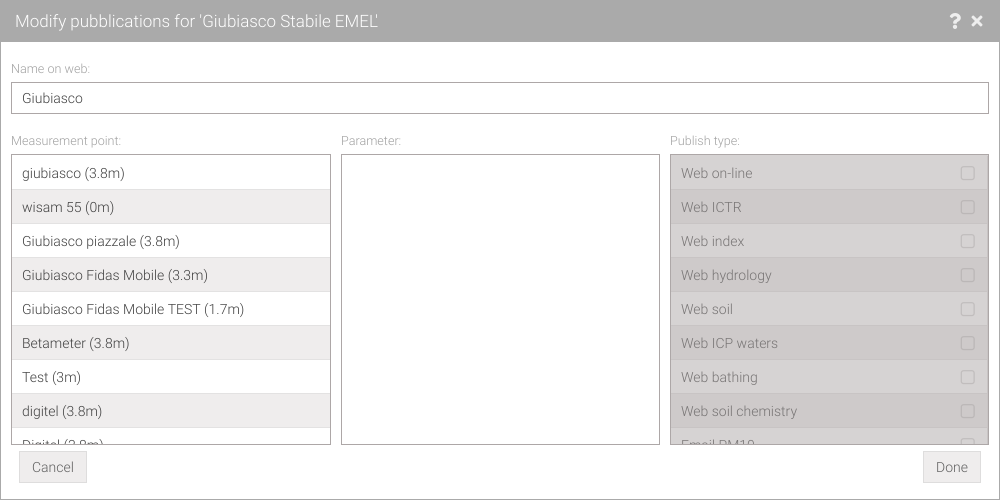
Fig. 283 Modify publications window
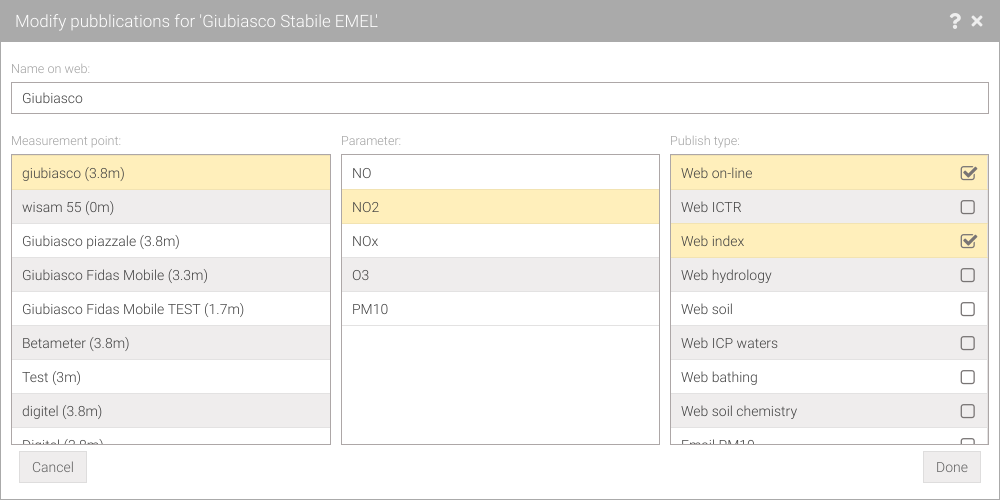
Fig. 284 Modify publications window with publish type active
Warning
For a location to get published it needs to have a Name on web set and at least one paremeter published.
Tip
To remove a published location without removing all of the published parameters just remove the Name on Web.
Remove
To remove a parameter or location from the publication Modify section.
Documents
A document is linked to a specific location. In addition, a document can also, as is the case with publication by location/parameter, be published through its publication types (Table 4).
To access this tool, click on the icon and then in the side menu.
In this view (Fig. 285) all the available documents will be listed.
By double-clicking on a document or clicking on the button, the document preview can be accessed (Fig. 286). Supported formats for previews are .png, :file:.jpg`, .pdf, .doc(x) and .xls(x).
Using the Locations filter field, for filter locations by identification code, city, or personal label. It’s also possible filter by publish type via the All publish types drop-down menu.
To download the document click the button.
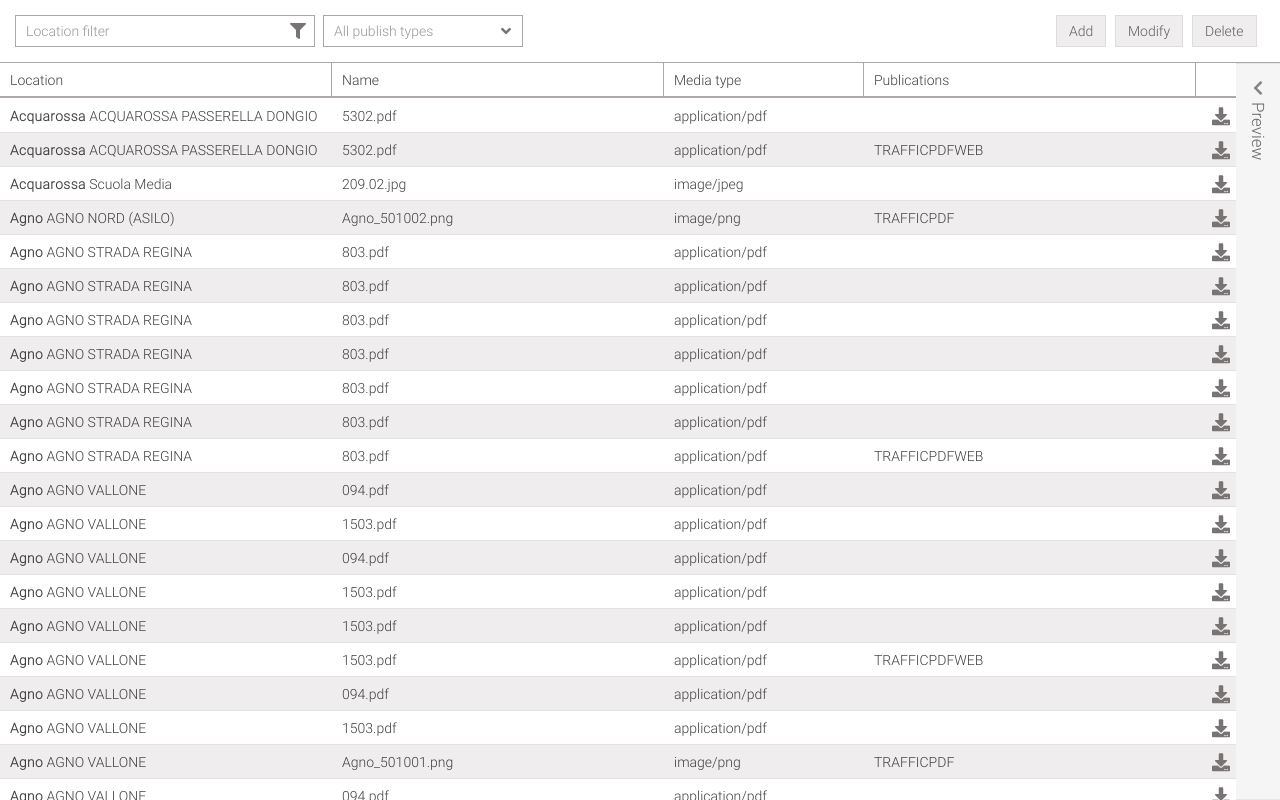
Fig. 285 Documents list
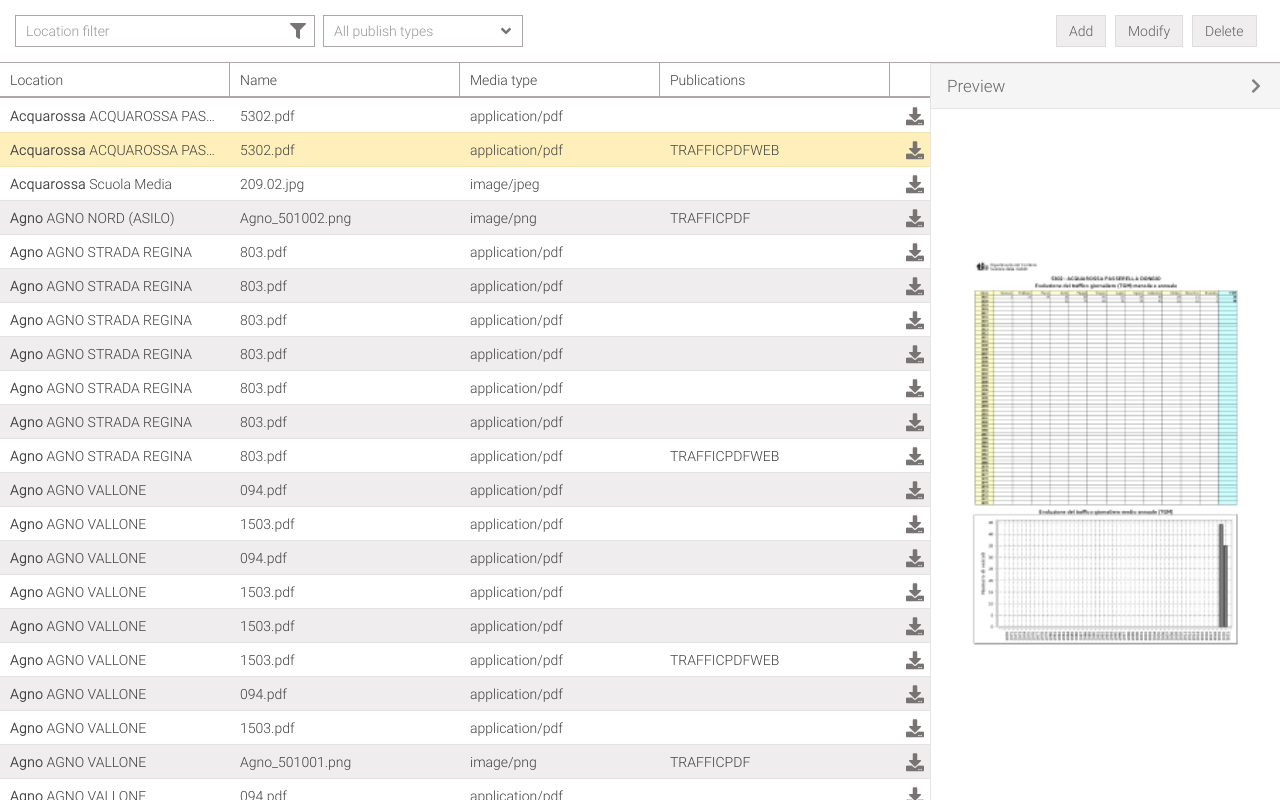
Fig. 286 Documents list with preview
Publish type |
Description |
Active |
|---|---|---|
Web on-line |
Publication of pdfs to online data web pages (e.g., Aria page) or station images to the survey stations web page |
yes |
Web pdf traffic |
Publication of pdfs on the traffic counts web page |
yes |
Web pdf RNI |
Publication of pdfs on the non-ionizing radiation web page |
yes |
Web pdf ICTR |
Publication of pdfs on the cantonal waste-to-energy plant web page |
yes |
Web pdf hydrology |
Publication of pdfs on the hydrology web page |
yes |
Web pdf bathing |
Publication of pdfs on the bathing web page |
yes |
Tip
In the document list, selected rows can be copied.
Add
Clicking on the Add button (Fig. 285) will open a window which allow to add a document (Fig. 287). Click Done to add the document.
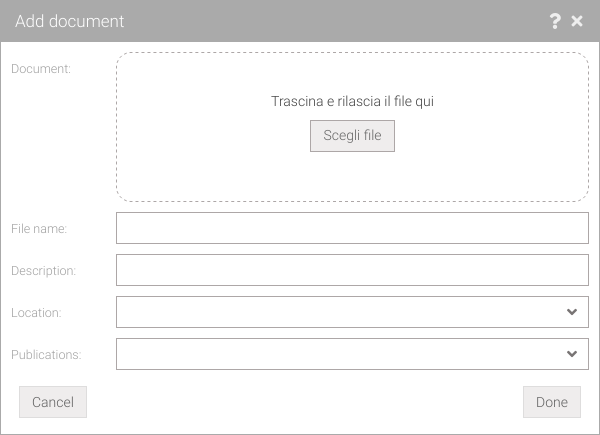
Fig. 287 Add document window
Tip
The document can also be added by dragging it into the dashed box.
Note
Mandatory or incorrectly filled fields will be marked with red borders. Moving the mouse over the relevant field will give an explanation.
Modify
For modify, select a desired document from the list (Fig. 285) and click on the Modify button. This will open the same window for adding (Fig. 288) but with already filled fields for the selected document. Click Done to accept the changes.
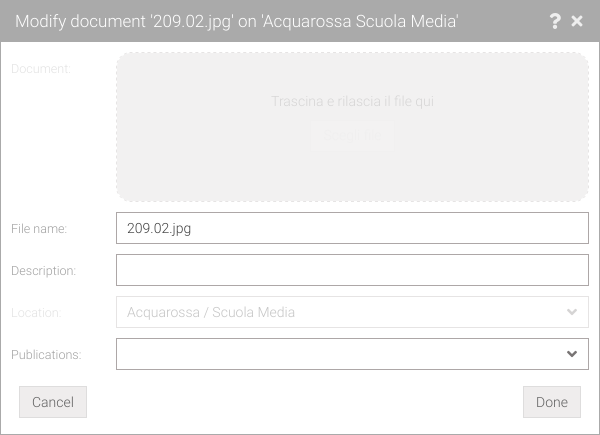
Fig. 288 Modify document window
Note
Disabled fields (shown in a slightly lighter color) cannot be edited.
Remove
To remove select desired document from the list (Fig. 285) and click on the Delete button. Confirmation will be asked if really want to remove the selected document.
Warning
The remove action does not check if the document is published, and removing it can cause web pages to work incorrectly.
Print
It’s possible to print the alarms (Fig. 285) by clicking on the button in the header bar which will export the displayed table in .csv format. To print the document will have to download it.
The applied filters will also kept in the exported file while the sorting will not.